We are ready to introduce a highly customizable data visualization prototype code-named SensGraph. It provides easily extendable capabilities, which allows us to build a web application cut to the specific client’s needs.
Based upon this prototype, we can offer the development of a web app, integrate the created web app with your software and provide any related technical support and training.
The created prototype represents an online demo that simulates the behavior of a real web application for real time visualization and remote monitoring of any data coming from any realtime data source. For example, sensors, PLCs or any other piece of monitoring equipment as well as from databases, webpages and desktop applications, etc.
The set of visualization capabilites of our prototype allows drawing and rendering data in customized digital dashboards:
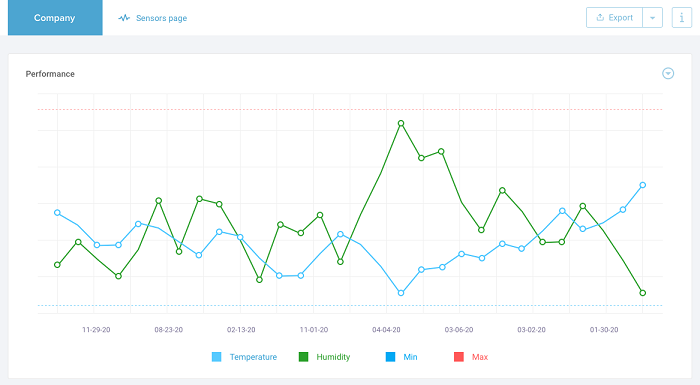
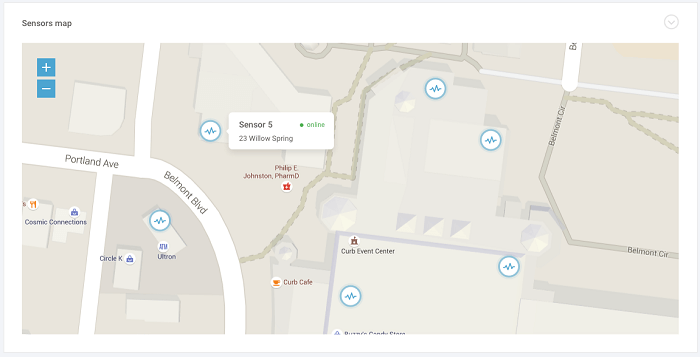
The prototype is powered by Webix charts, graphs, grids and, upon request, can integrate geospatial tools, such as Google Maps, OpenStreetMap, or any customer’s premise layouts. See an example below:
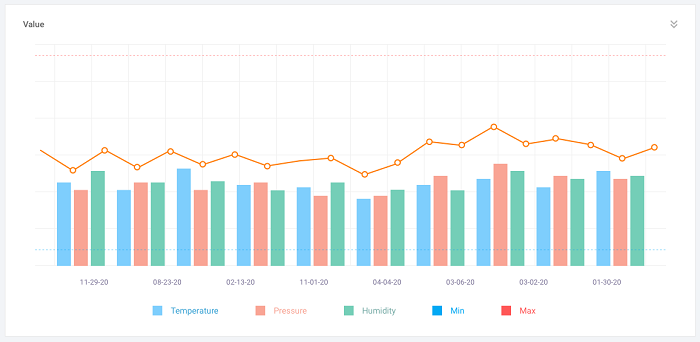
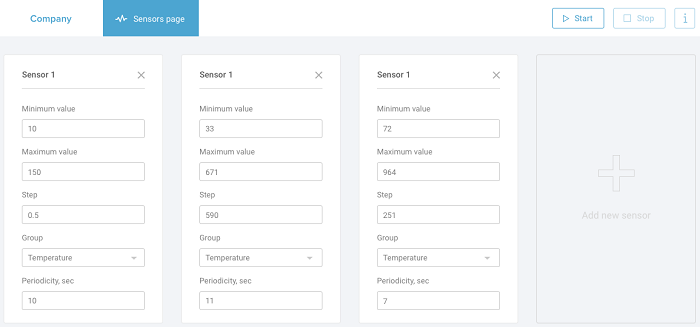
The prototype allows visualizing data from a connected database of a pre-configured and user-customized set of equipment or sensors. Sensors page allows to add and manage sensors. It accesses raw sensor data provided by the client. See an example below:
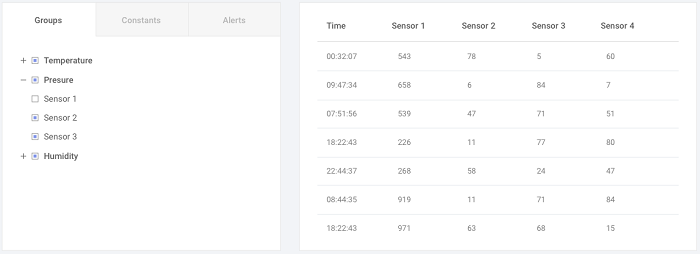
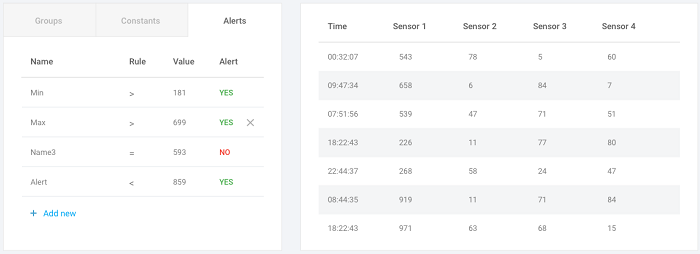
It allows grouping sensors by value (for example, by temperature, by humidity, by pressure, etc). With the SensGraph prototype you can view incoming data, create alerts in case any values deviate from the set parameters and generate reports in PDF and Excel files.
Key Features:
- Uses high performance charts, graphs and data tables
- Integration and rendering of data from systems, sensors, devices in digital dashboards
- Supports data from multiple data sources
- High customization capabilities
- Displays a variety of real-time monitored data
- Automatic alerts triggering based on user-defined configurations
- Reporting (data export in Excel and PDF formats)
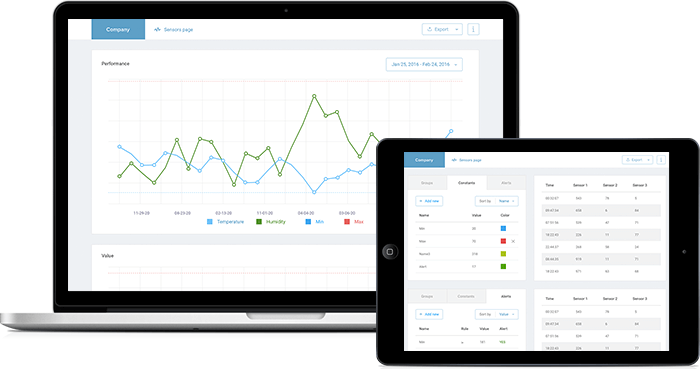
- Multiple device support (PCs, tablets)
- Remote access from any PC or mobile devices and from any place through a web browser
Offered Capabilities*
- Can be easily configured to the needs of the client’s equipment
- Can render and visualize data from a connected database of a pre-configured and user-customized set of equipment or sensors
- Displays states, conditions, performance, trends, alerts in digital dashboards
- Allows to monitor and evaluate data from any connected databases
- Can be deployed in the cloud
- Provides unlimited scalability
- Displays a variety of real-time monitored data
- Can connect a storage for historical data overview
- Can connect or integrate geospatial tools
- Allows to integrate any number of monitored data sources at any time
*can be added upon your request
Benefits For The Client:
- Increases awareness of operation environments to speed up decision making
- Minimizes operational losses
- Provides a unified access to all monitoring equipment data
- The system can be set up to instantly load generated data
- Allows to promptly eliminate equipment downtimes and achieve operational excellence
Multi-Purpose Application Use
Online data visualization software is excellent for fast data acquisition from actually ANY remote monitoring equipment.
Our prototype represents a high-performance tool for immediate data visualization and tracking in real time. We can visualize data from your database, server or any other data source.
It can be used to visualize data for:
- Intelligent heating control systems
- Smart house systems
- Water and wastewater treatment systems
- Energy Information systems
- Equipment control and automation
- Remote site monitoring systems
- Laboratory monitoring system
- Gas detection sensors, control systems & analyzers
- Any data centers
To request evaluation of the prototype, click on the button below: