Data Visualization Software
Create the most effective visual representation of your data. We squeeze huge amounts of data into exceedingly efficient charts, graphs, diagrams, and data tables.
Data is called the new world currency nowadays. Data surrounds us. It’s everywhere: on product labels, in an organization’s reports, and in different equipment (sensors, controllers, etc.). Sometimes it can be difficult to present data in an appropriate way.
Gathering and analyzing data can be time-consuming. Therefore, XB Software experts build visual dashboards and reports to improve your app usability and performance, express any piece of data, discover underlying trends, and make data-driven decisions. Data visualization software we create are end-to-end, interactive, and mobile friendly solutions that provide immediate access to data.
When Does Your Business Need Data Visualization Software?
you need to have access to real-time data that you can manipulate and interact with directly
you are planning to expand your business or grow the departments
your company has great amount of business data flows
your company needs to analyze different information about customers, suppliers, and vendors
Valuable Data Visualization Components to Your App
Data visualization and data management widgets can improve your application’s usability and performance characteristics.
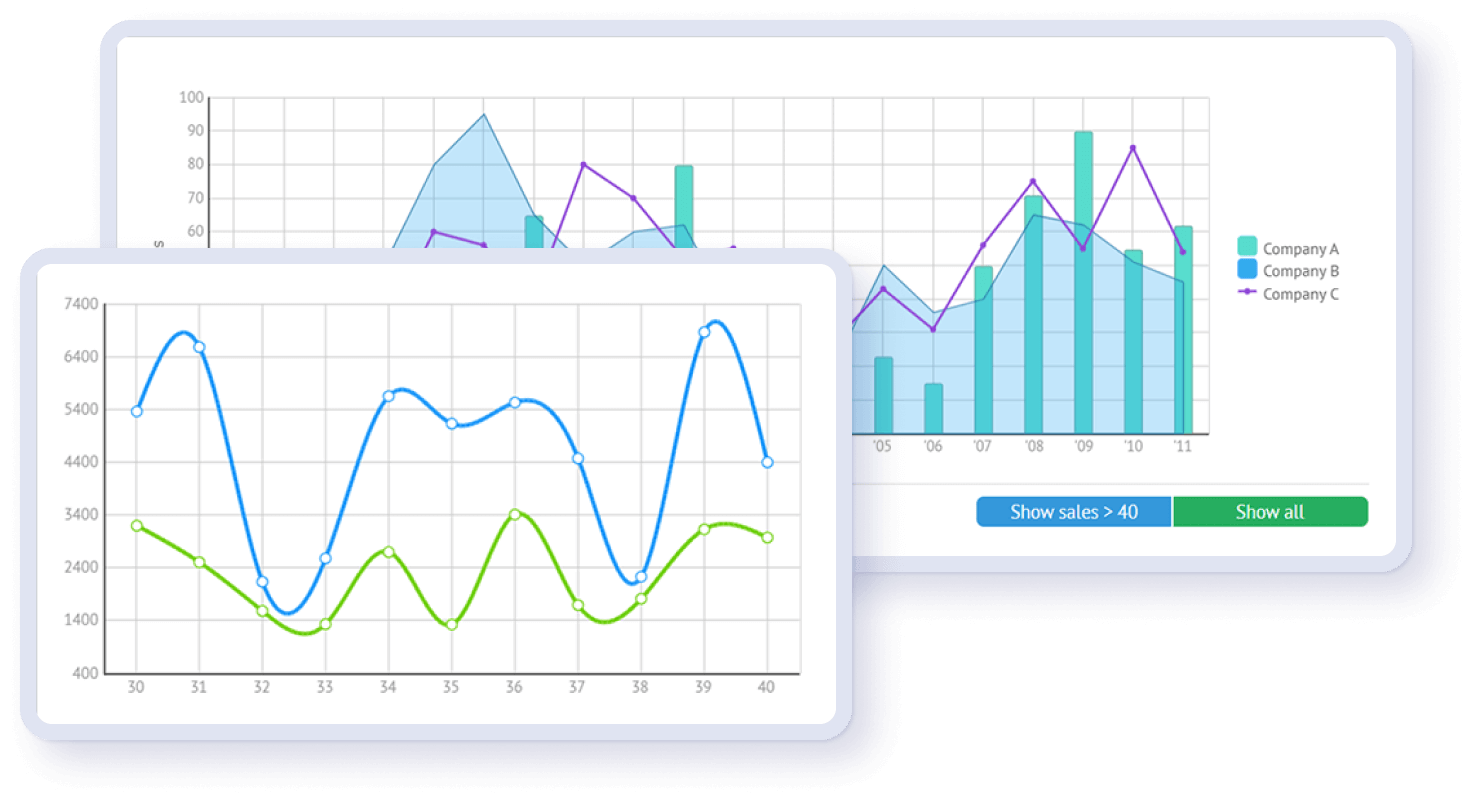
Data Visualization Charts
An enormous variety of data visualization charts and graphs can be customized to the desired look and feel. They can become a valuable addition to your data visualization application.
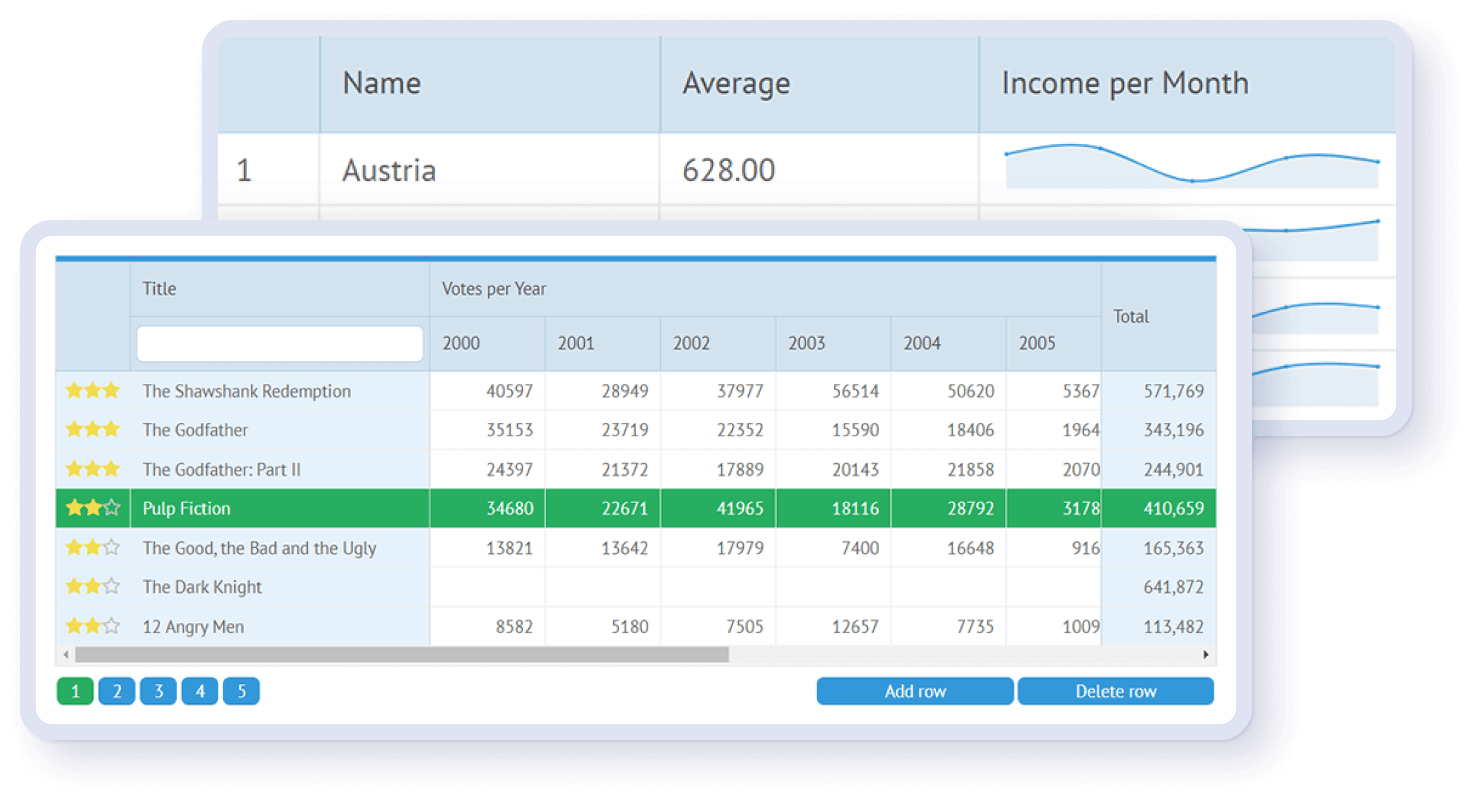
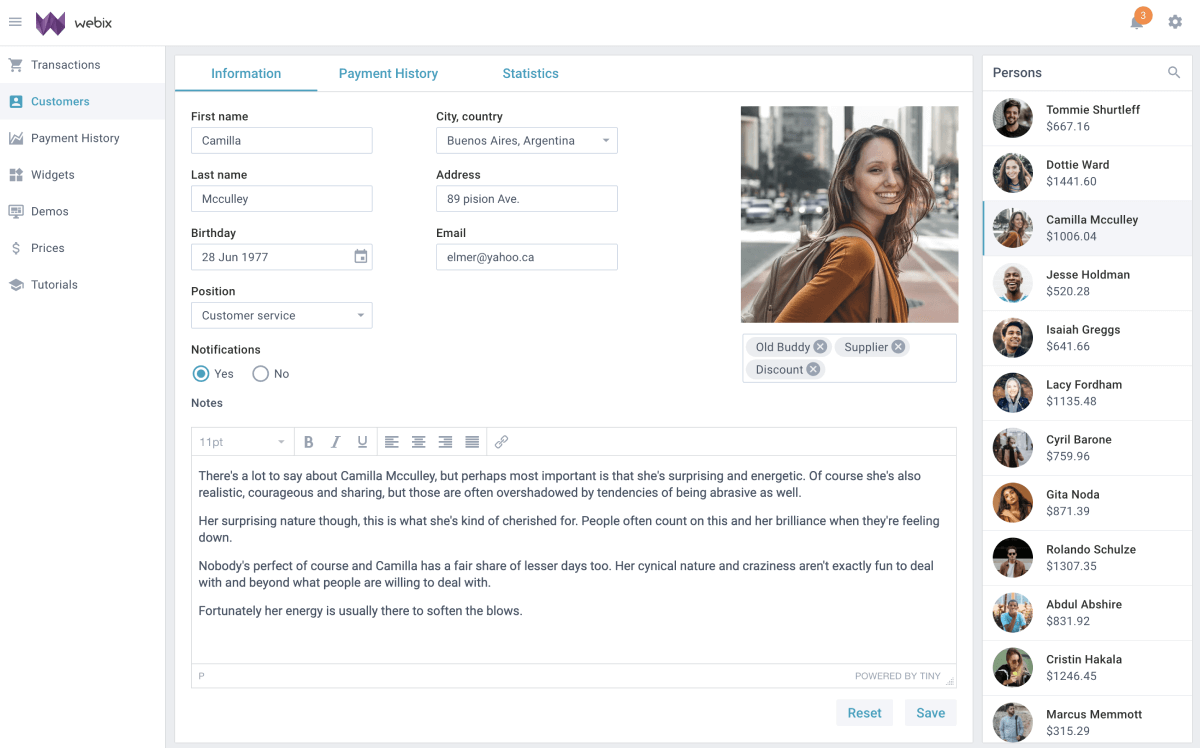
Data Visualization Tables
Grids can contain a huge amount of data that renders in the blink of an eye. A data table can load many rows and columns in no time to provide users with required data.

Hierarchical Diagrams
Organogram — a great widget to display different correlations in a complex system. Can be used to build family trees, company structures, etc.
Treemap — another hierarchical data widget to display a large number of data on the screen at once.
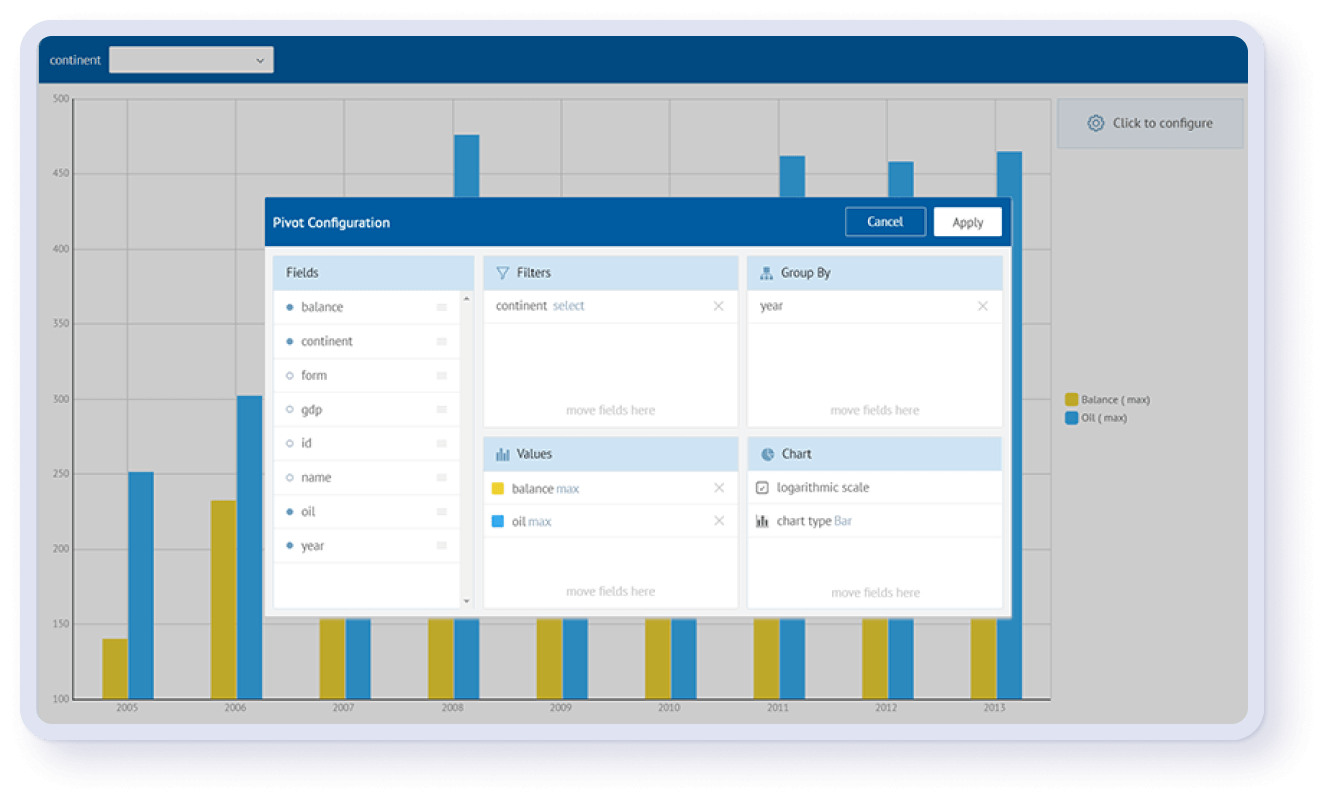
Pivot
You can create interactive table reports that can be embedded into your application. It allows you to automatically organize, filter, and compare complex data from database files.
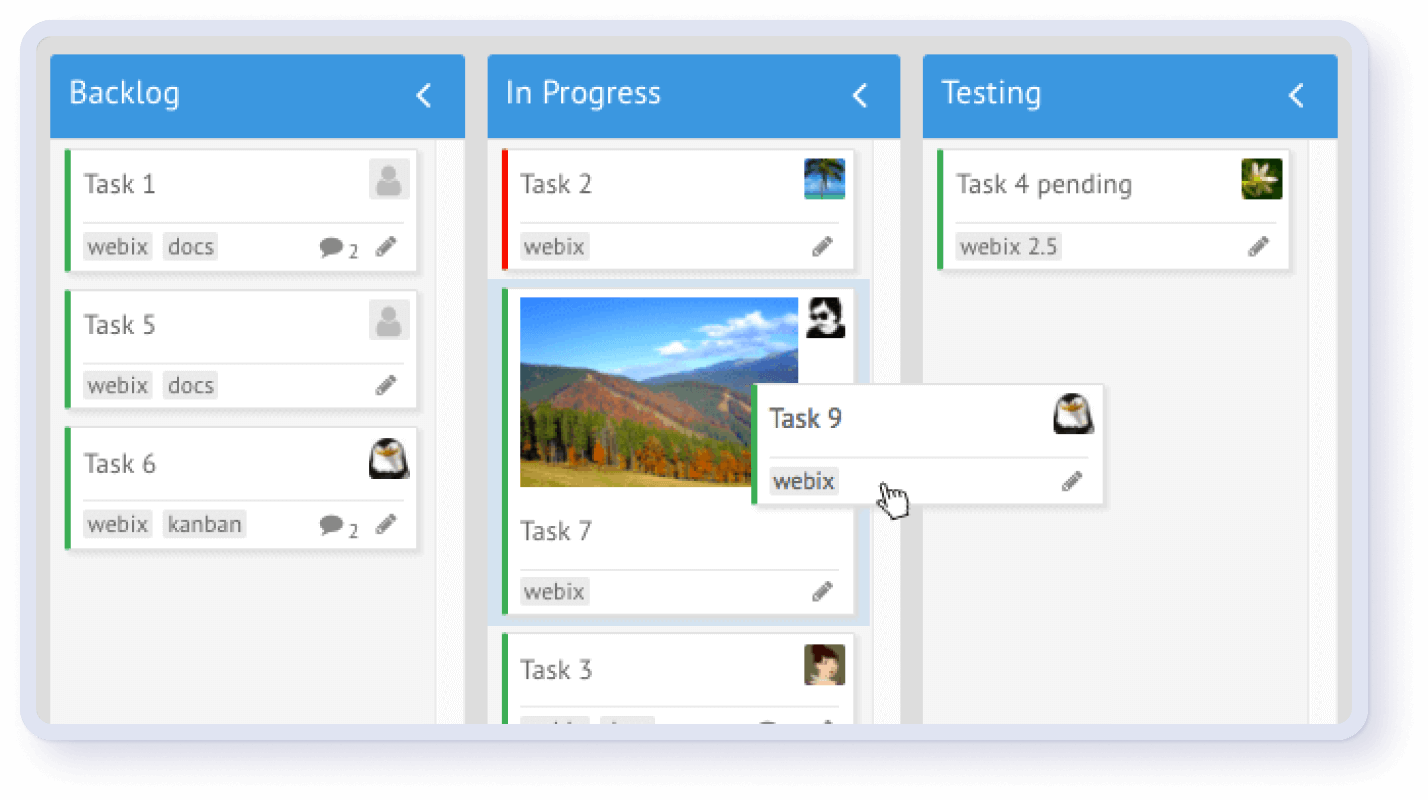
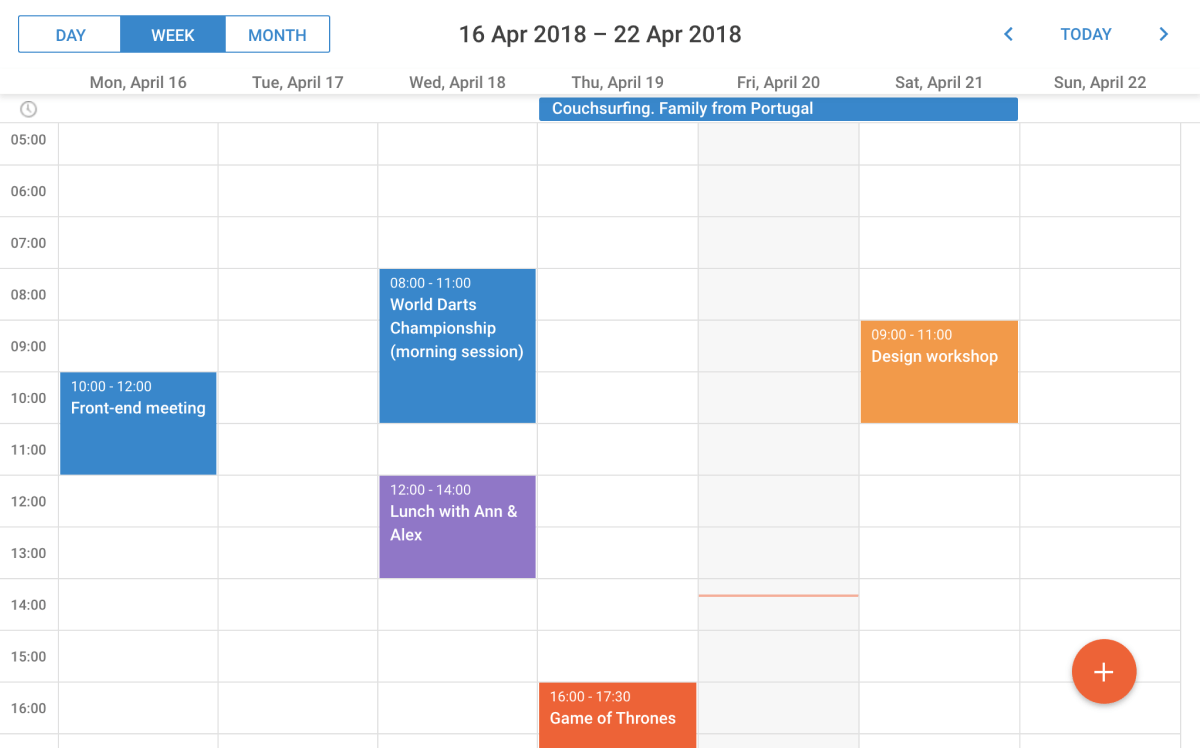
Kanban
The Kanban board is a great tool to visualize your day-to-day workflow and skillfully manage business processes. The Kanban widget is designed to improve communication and collaboration between team members, smooth the flow of work, and distribute the workload better.
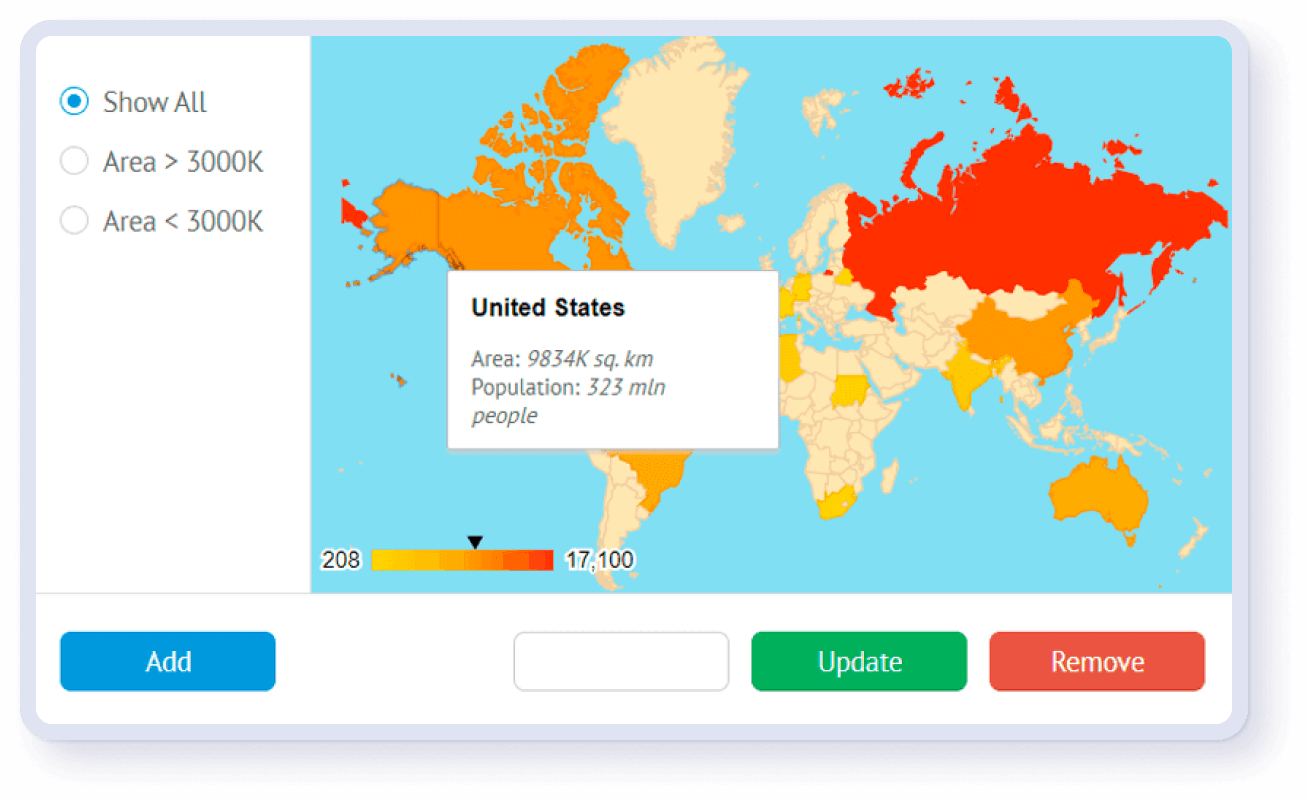
Geo Maps Integration
We can embed geographical maps into your application, such as Google Maps, HERE WeGo (aka Nokia Maps), OpenStreetMap, Yandex Maps, etc.
Benefits of Data Visualization Features for Your Business

Get relevant business insights faster
Graphs, diagrams, and data grids enable managers to grasp information about business processes easily, faster interact with product management and marketing, and get the full overview of business and operating dynamics.

Better understand interactions between operations and results
Allows executives to view and trace data correlations between business operations and overall business performance.

Quick analysis of customer behavior
Learn your consumer behavior in a simple way. This knowledge will allow you to improve your products and services and finally enhance customer satisfaction.

Drilldown and predictive sales analytics
Allows managers to better analyze sales data, view which product groups are performing well or underperforming using data-visualization tools.
Why We're The Best Choice For This Job
We specialize in creating charts, graphs, diagrams, data grids, and other visualization tools.
One of our most powerful products is the Webix JavaScript UI widgets library. It represents a set of JavaScript online data visualization tools and widgets, allowing you to render data to tables, Gantt charts, and diagrams. It’s not only the ready-to-integrate and ready-to-use components that we provide our clients with; we also help customize them for the perfect fit!
Moreover, we also have years of experience in building enterprise web and mobile apps with rich and interactive interfaces using the DHTMLX JavaScript UI components. We can customize other 3rd party tools and out-of-the-box solutions upon your request.
Data Visualization Software We Have Created


Fill the form to get a no obligation consultation from our experts
Your questions and requests are always welcome