Online Data Storage Application Of High Performance
A web-based system built to provide instant access to one of the most complete sources of data and statistics on developed and developing markets. It is created for analysts, consultants, academic institutions, corporations, econоmists, government managers, investment banks and others who need to do fast research and data analysis.

Business Challenge
The customer had big storage of most accurate economic information, including key economic indicators and industry trends in different countries, which were updated almost instantaneously and implemented by experts on the ground in different countries. The main challenge was to create a high-performance system that could process about 15 million data series from different time periods and different countries, making them accessible for over 500,000 users at a time.
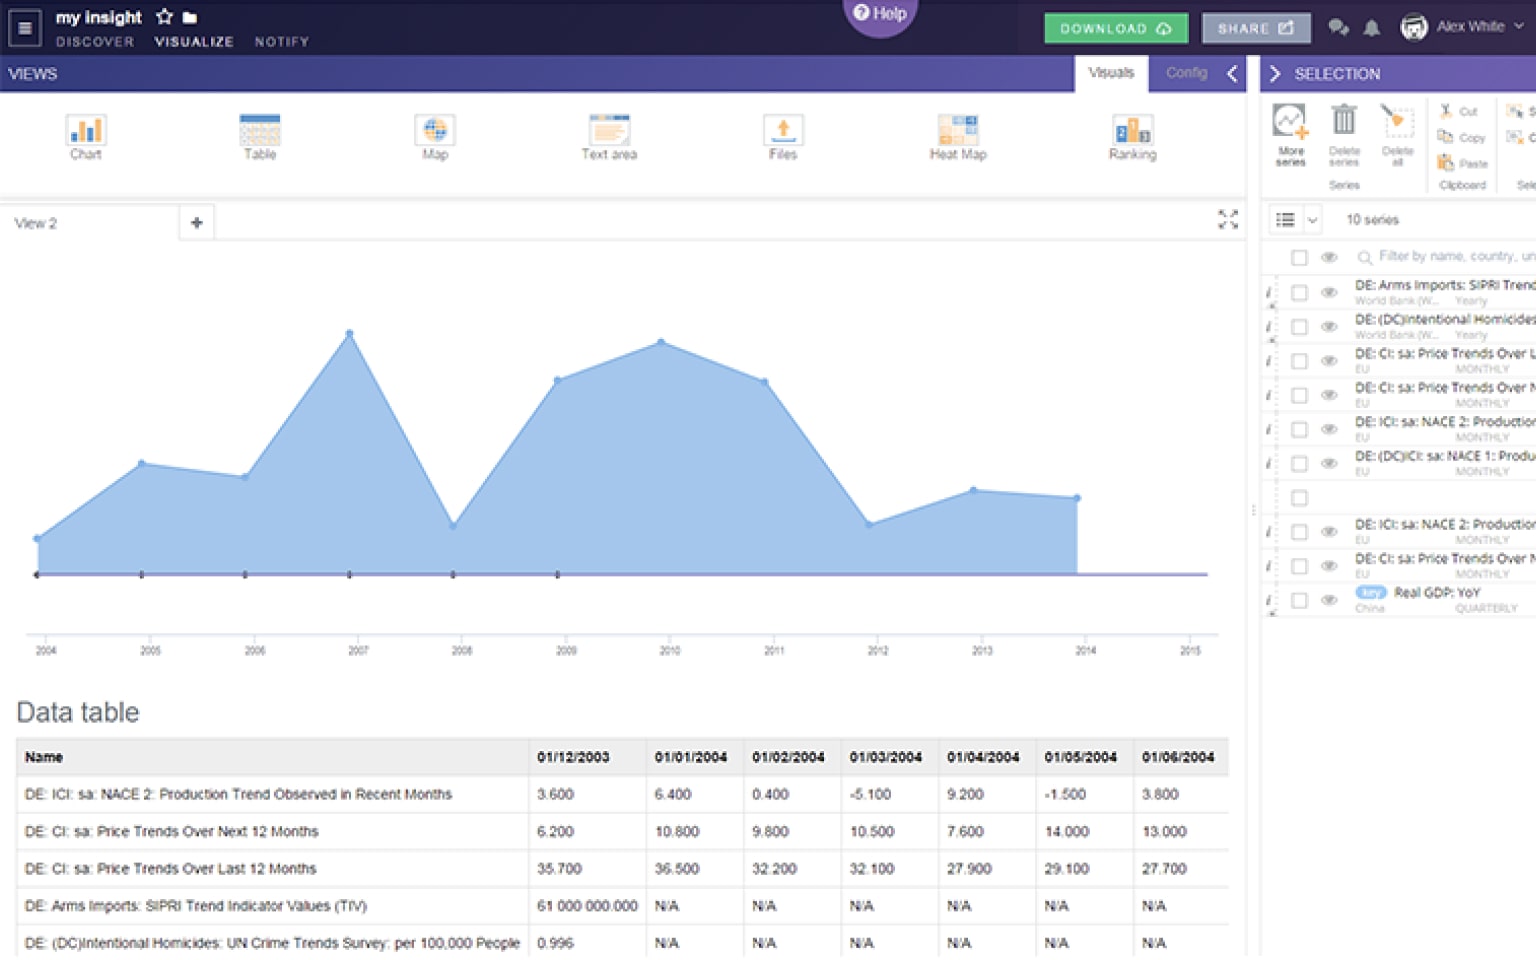
Besides, the system should have been designed to let users create over 1 million insights (projects) in total and process them online. Users should be able to select necessary series from the selected database and point out the required frequency of series update (daily, weekly, monthly, quarterly, semiannually, yearly), select dates, data format, and other parameters.
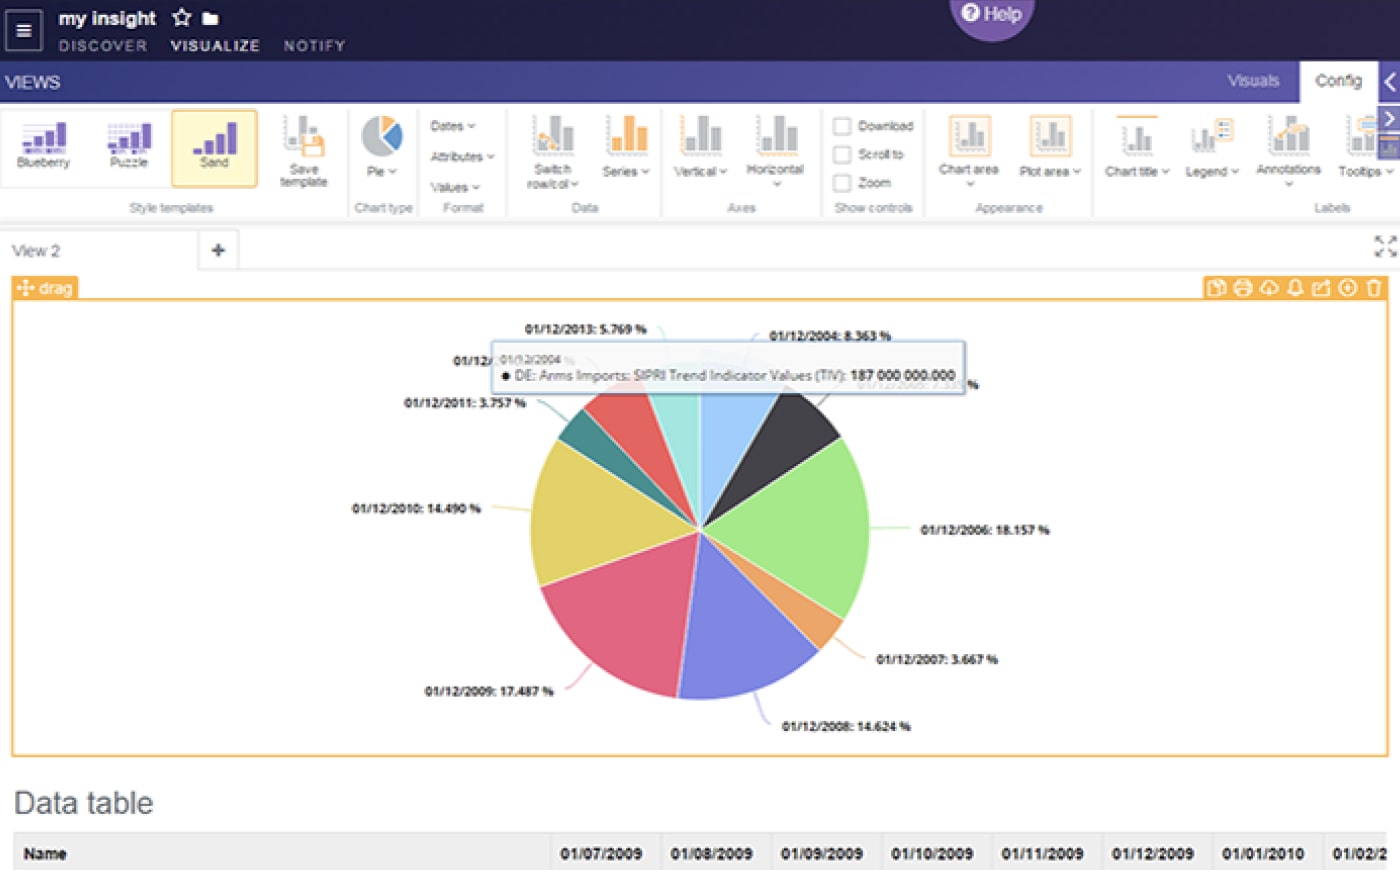
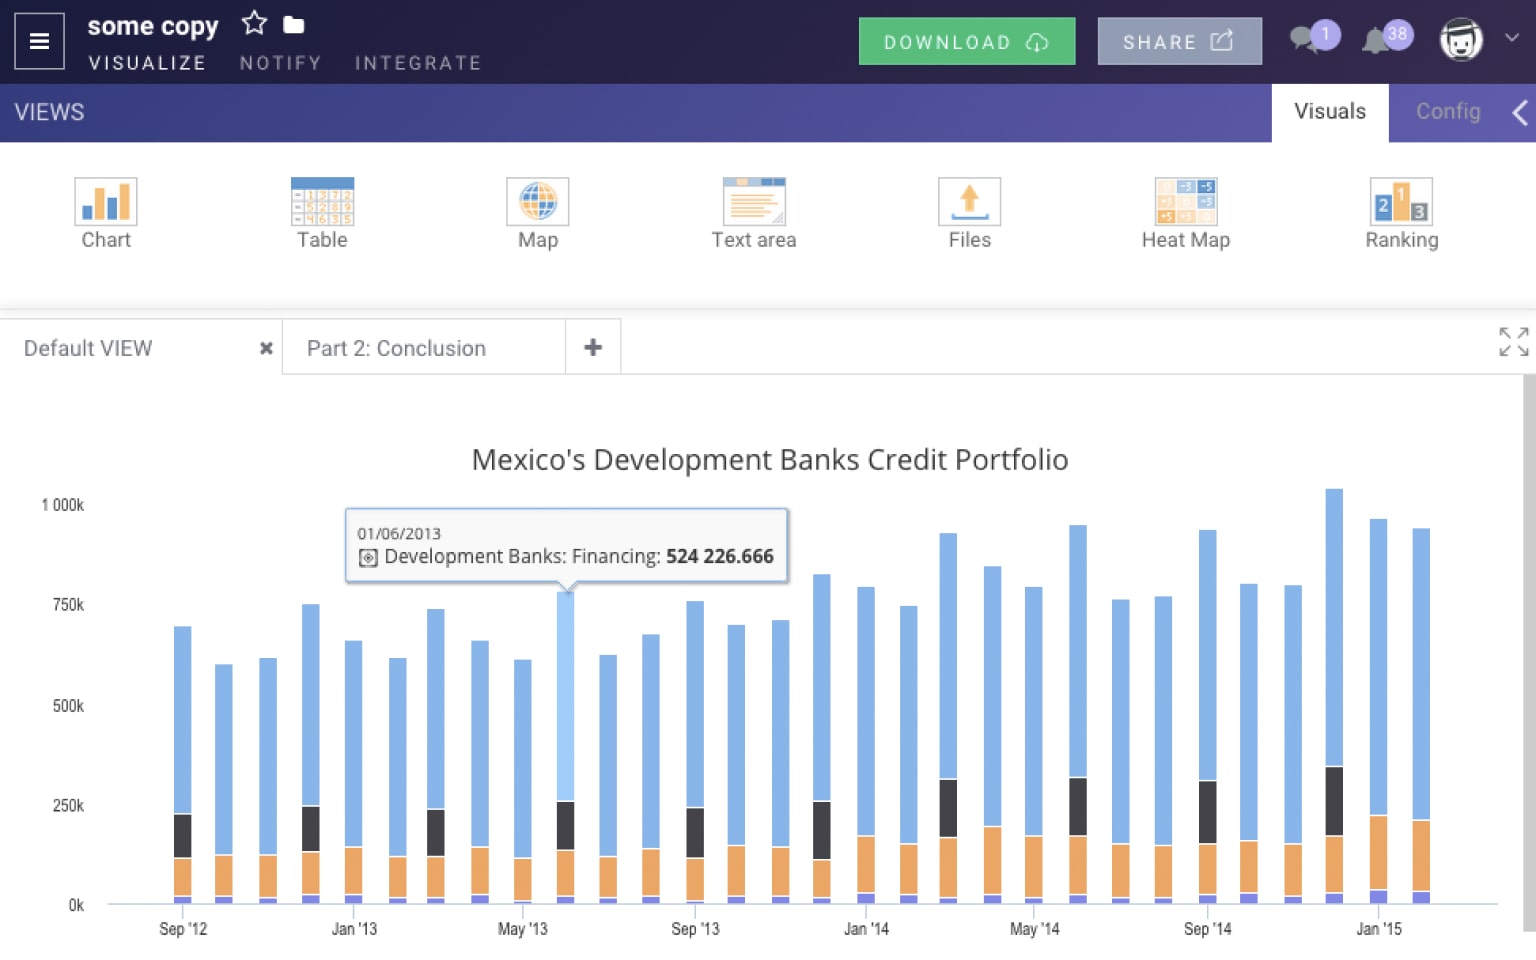
The data should be arranged in different views (charts, tables, maps) and presets. Besides, it should be possible to share information between users for better collaboration, send notifications and add comments.
Solution
XB Software team was challenged to develop a high-performance data storage with an instantaneous update of a huge amount of data at increased user load. The team managed to create a scalable web application using the most up to date technologies. The app logic is implemented with Node.js and JavaScript. The system consists of several Node.js servers to balance the load across the servers.
The application uses Apache Solr search platforms which make series fully indexed and searchable and facilitates fast data search by any key-values in the indexed documents. The first Solr engine is connected directly to MongoDB and is used to search by the series cache. The second Solr engine is populated by Java with actual data from MySQL. These data are indexed by SolrJ.
Complex math calculations are possible thanks to the use of Java. To create highly structured databases our developers used MySQL, MongoDB, and Redis. Java server processes data from MySQL database. To generate previews for each created insight PhantomJS was applied. To structure and visualize a huge amount of data, we used a variety of libraries, such as Backbone Framework, Bootstrap, SCSS preprocessor, Webix, Underscores, and Highcharts. Namely: tables were made with the use of Webix Pivot Table and Datatable, charts were made with the use of Highcharts, maps – with Highmaps. To arrange a program code of the entire app on the client-side we used Backbone Framework.
Bootstrap was used to create a nice-looking app layout and other UI components. It was also used to create popups and tooltips. To enable real-time update, WebSockets were used. As for the server-side, it was implemented with Node.js.
Project in Figures
Duration
man-hours

Applied Technologies


Result
XB Software team developed a powerful data storage system that meets the customer’s requirements. It is implemented as a cloud solution hosted on Amazon EC2.
The system we developed provides the following benefits:
- fast access to comprehensive and accurate statistical information in different economies
- allowing its users to make the smartest assessments and decisions.
The created app is user-friendly and touch-responsive. It works flawlessly on iOS and Android tablets.