Rate Management System
A complex currency exchange rate management system that is used for tracking stock and currency rates in real-time with a smart notification system for efficient management of clients’ orders. The interactive tool for stock data visualization provides searching for new opportunities by analyzing and dynamic scanning numerous markets.
Business Challenge
An onrush of information technologies has moved the stock markets closer to investors. Nowadays, everyone can find detailed financial data of listed companies online, usually for free. Online brokers have made the process of stock trading simpler and more inexpensive. However, you need not only to be aware of some of the market characteristics but to be a master of robust and scaling trading solutions and apps to manage your investments effectively. Traders need sophisticated and comprehensive financial data visualization software to better analyze the market situation.
The client requested to develop an interactive, complex, real-time stock rate management system that allows users to implement accurate technical analysis and displays live market data on currencies, options, equities, and futures in a web-browser. The main feature of the stock market data visualization app is to help traders to build an efficient trading strategy for future steps.
Solution
Our web development team was asked to build a robust and scaling rate management system to allow users to trade in real-time. The customer needed a solution for visualizing live complex market data. The system should handle constant traffic of large financial data streams with a range of plugins to serve each individual purpose.
The frontend of the financial charting software was implemented using React.js development. The backend of the system was built using Node.js and MySQL.
To develop scaled and structured databases, our programmers used MySQL, MongoDB, and Redis. Bootstrap was used to create an attractive look of the rate management system and other UI components. To implement real-time update and collaborative work of multiple users, WebSockets were used.
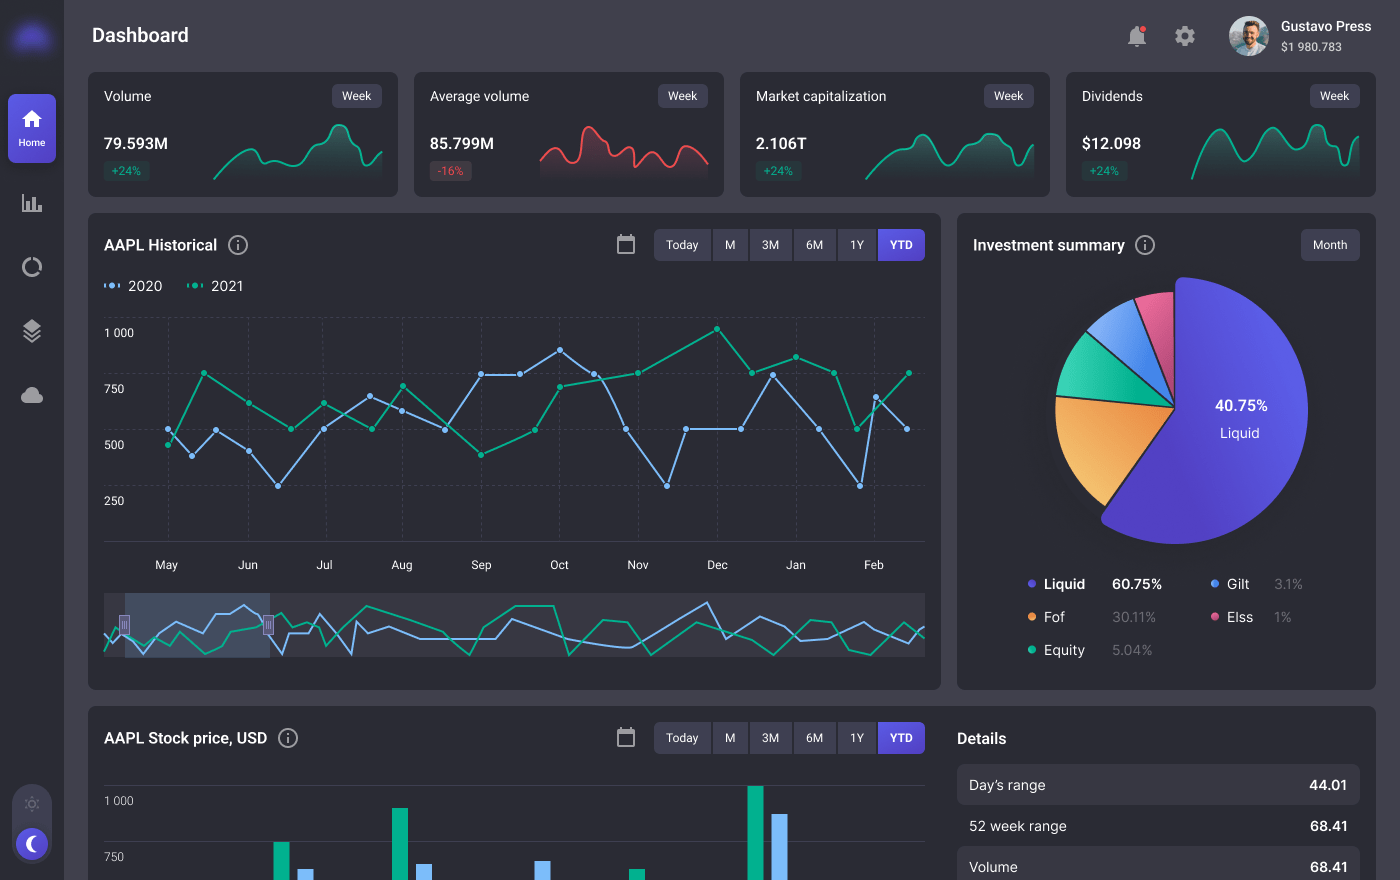
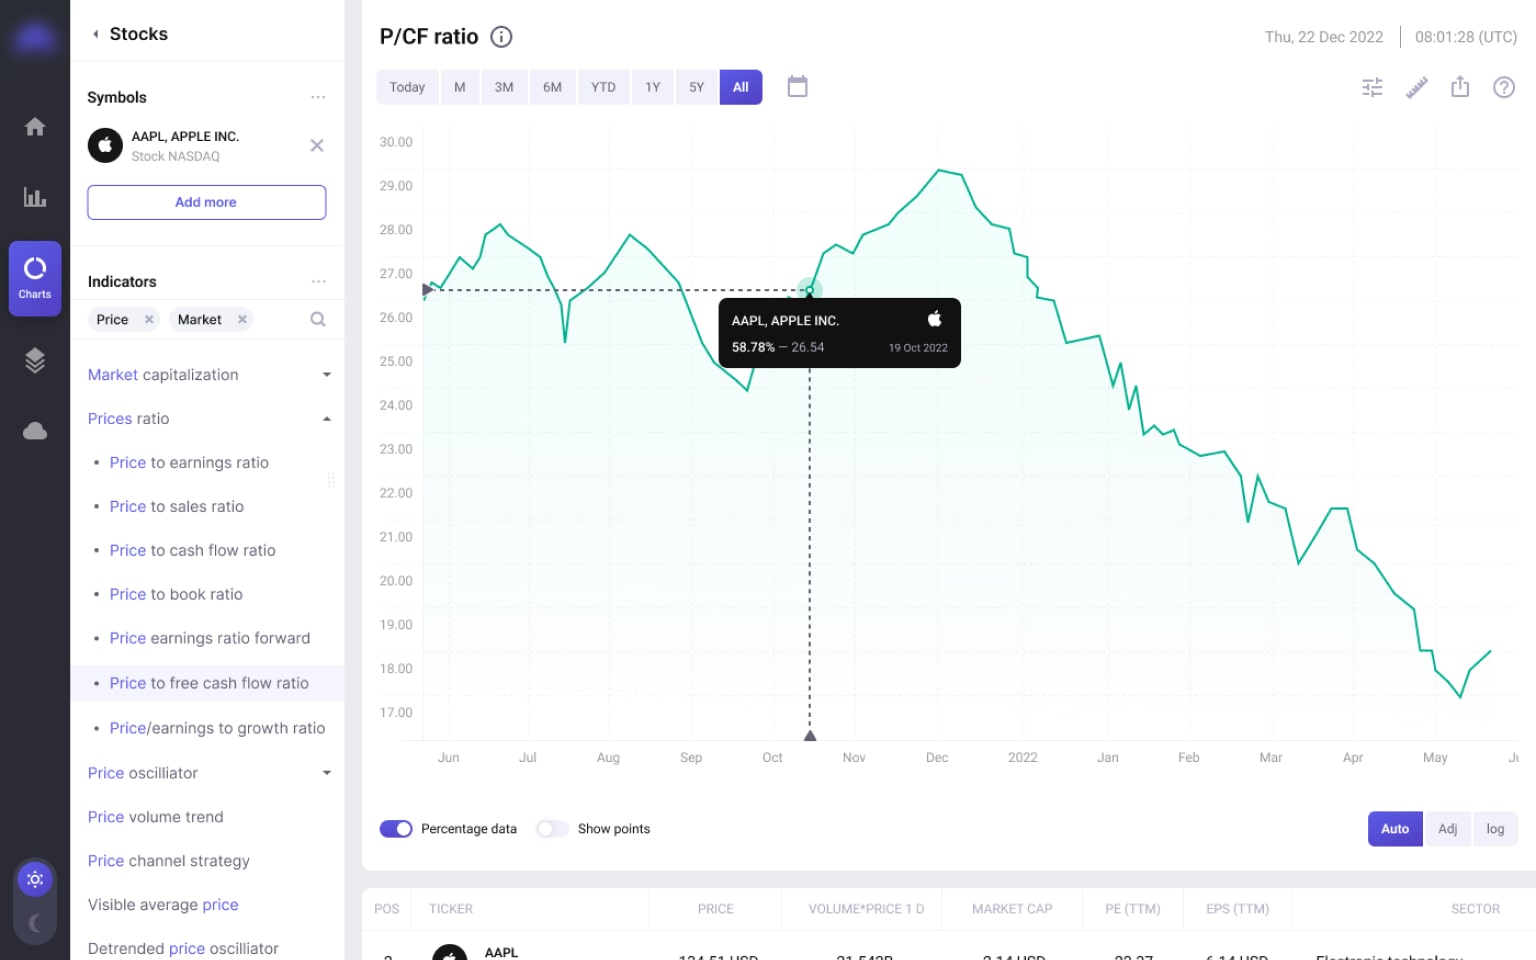
To structure and visualize a huge amount of data, our team used different libraries, such as WebSockets, Backbone.js, HighCharts library, and React.js. The system provides support for tablets and dozen types of data visualization styles: Line, Bar, Candlestick, OHLC, etc.
The feature of implementation as a single-page application helped to operate with data promptly.
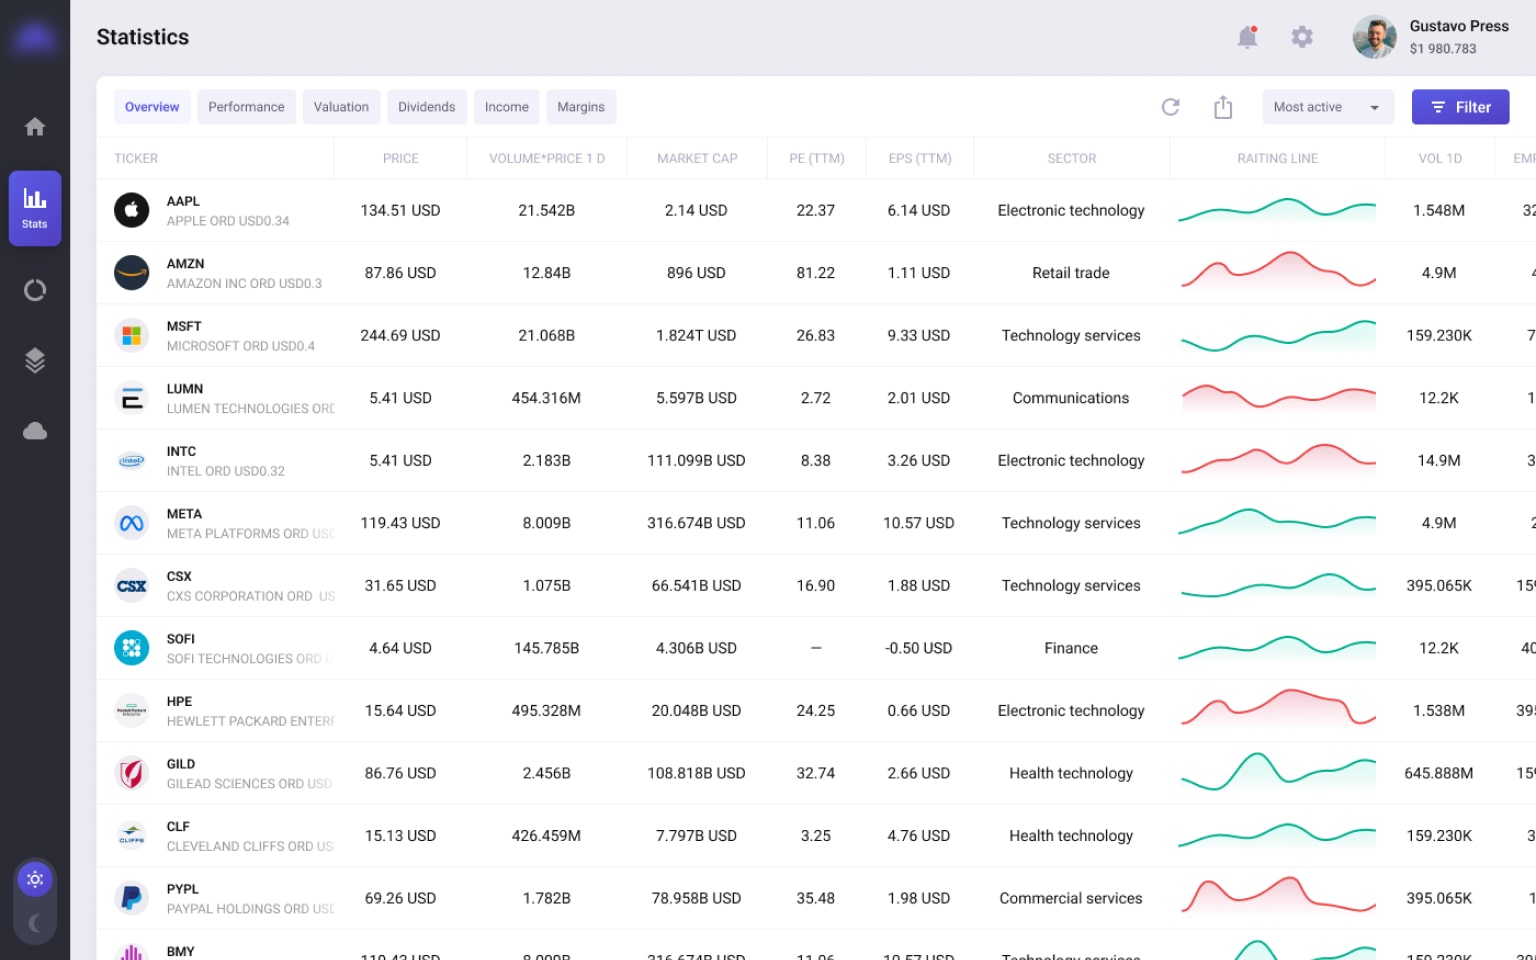
The financial charting software uses Apache Solr search platforms, which make series fully indexed and capable of being computationally searched. The system facilitates fast data search by any key-values in the indexed documents. The data are indexed by SolrJ.
PayPal technology was implemented to provide stable and secure payments for users of the app.
Interested in developing a similar solution or have your own idea in mind?
We are ready for any challenge, just contact us!

Project in Figures
10
Months
Duration
Duration
3200
Estimated
man-hours
man-hours
Applied Technologies


Result
XB Software team developed an interactive and complex exchange rate management system that allows users to create their own indicators using personal criteria of scanning and ordering numerous statistical data and indexes in real time. The rate management system allows searching and scanning of predefined and custom conditions of the market.
The analytical research shows that such indicators as:
- the number of users and visitors increased by 17,8%;
- average session duration increased by 237,1%;
- bounce rate improved by 32%.
Let’s Talk About Your Project
What's next?

Vitaly Hornik
COO at XB Software, Ph.D. in IT (Computer Science), PMP
We don’t just deliver projects — we build partnerships.
What's next?
Requirements
A sales manager will contact you to understand a vision.
01
Estimation
We provide a detailed plan, timeline, and cost estimate.
02
Agreement
We finalize the contract and begin working immediately.
03