Web-Based Macroeconomic Forecasting Service
A web-based solution that gives a deep insight into the Chinese market by providing accurate key macroeconomic data to facilitate decision making by economists and strategic planning professionals.

Business Challenge
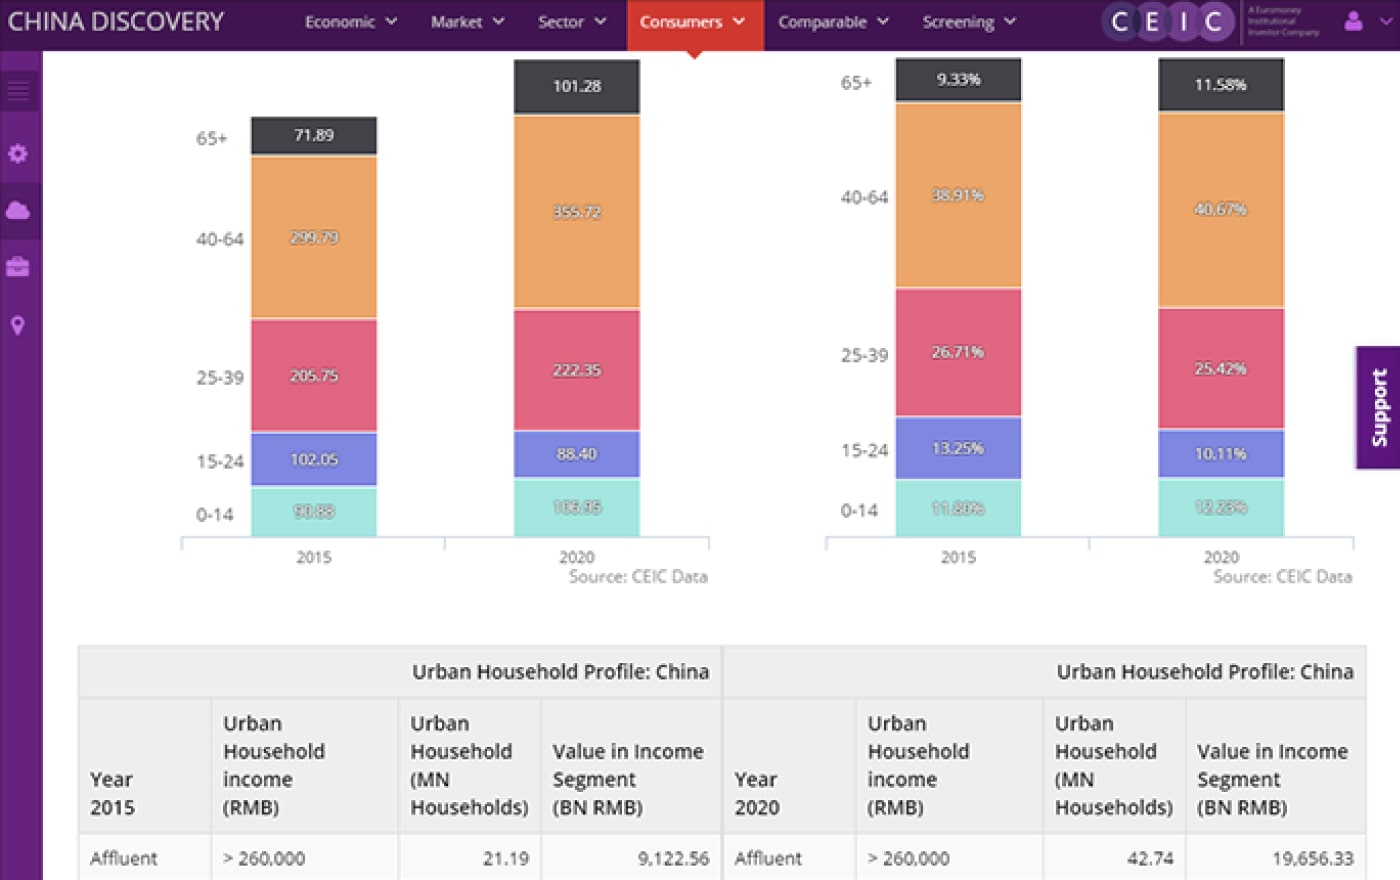
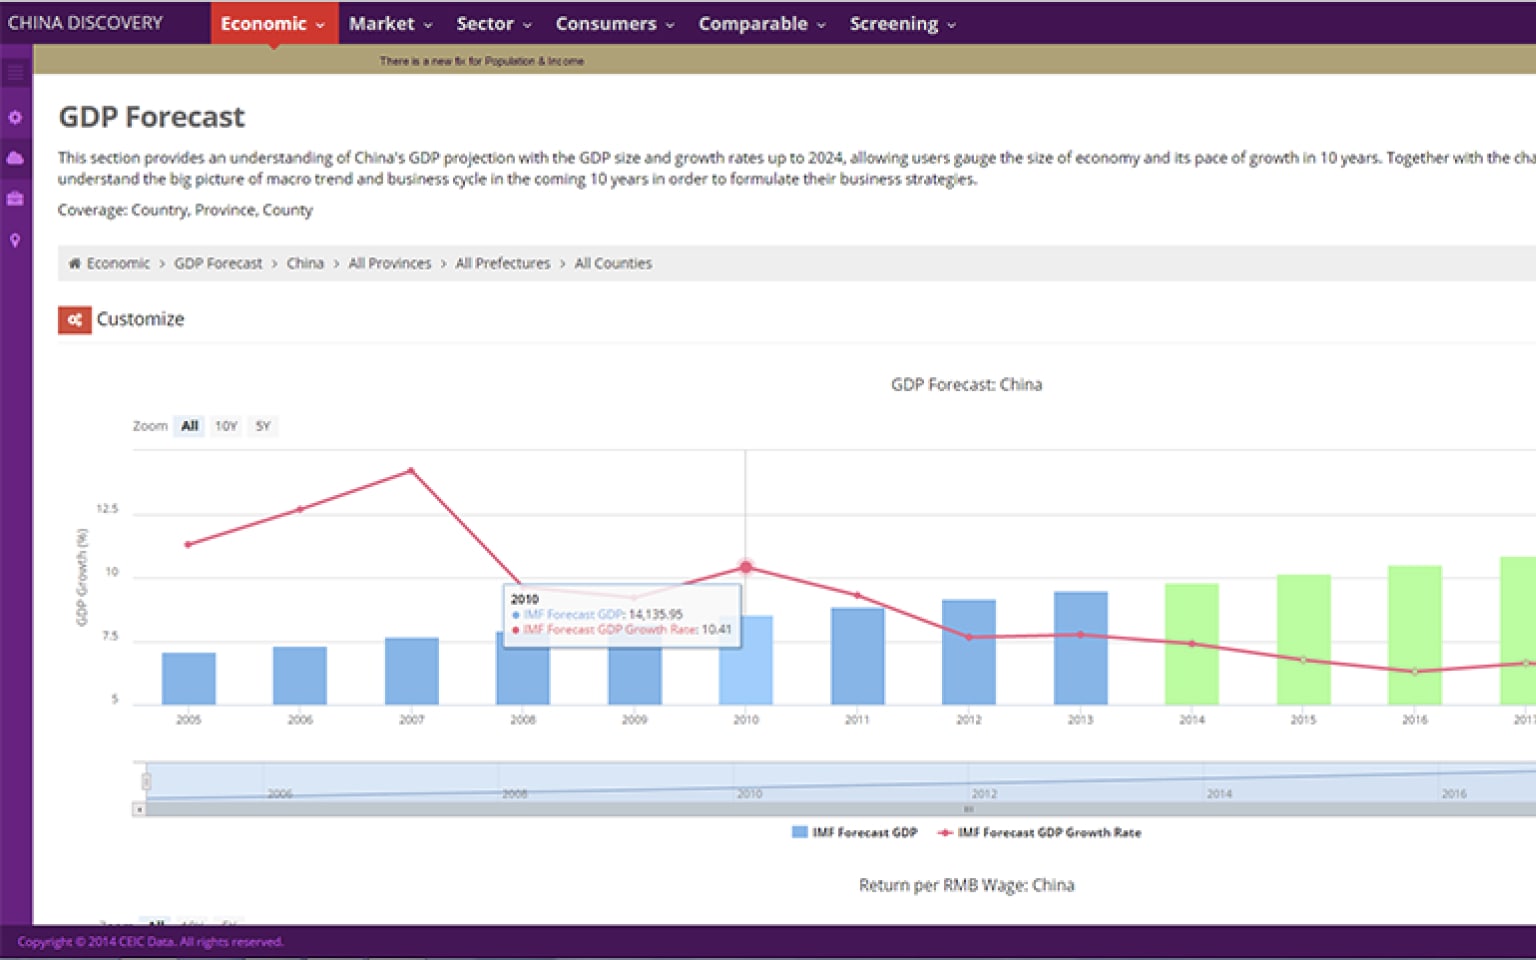
The customer was in need of creating an integrated and easy-to-use service that would visualize macroeconomic data, demographic information and proprietary demographic forecasts for the whole China market, help strategic planning by businesses and minimize business risks.
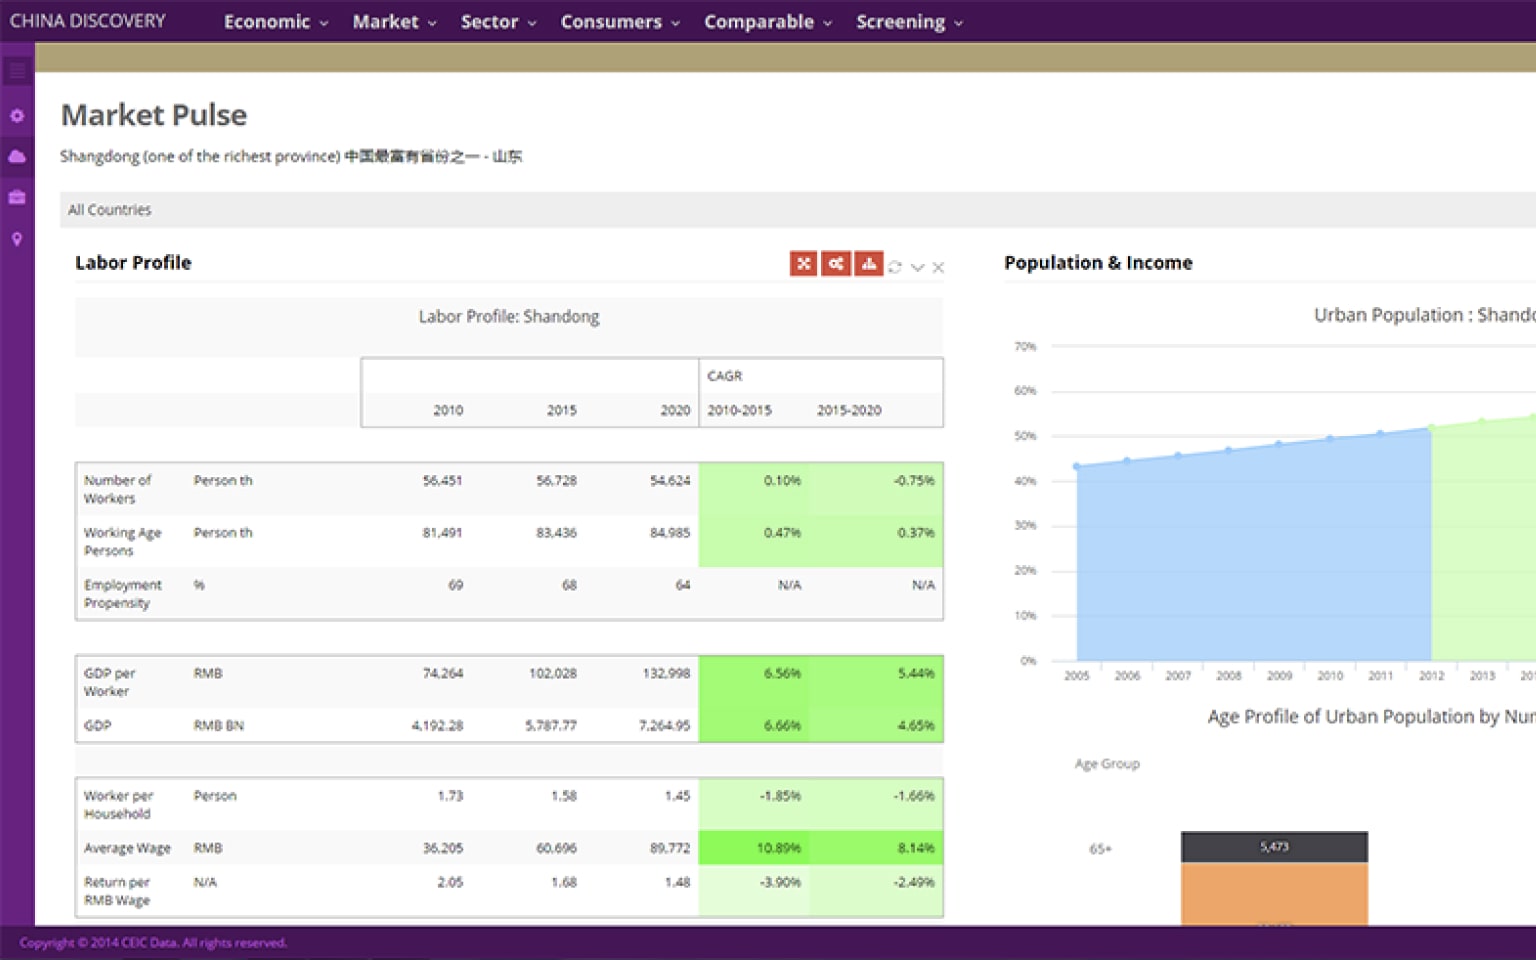
It was required that the developed system should include a number of tools that would help analyze China GDP forecasts and projections, investigate China business climate and market datasets (such as retail sales, PMI, sales breakdown, import, and export, etc.) in the short term. Besides, the customer wanted the system to be designed to keep all labor statistics and socio-economic data (confidence indicators, population, and income, consumption projection, etc.) in one place. The system should provide continuous data refresh to make sure that the provided information is reliable and up-to-date.
The users of this system should be able to customize the available data and filter data display by certain areas (county, province, and prefectures).
Solution
XB Software web developers team was challenged to create a web-based system with a big data load (around 2 million series in the database).
The created system was integrated with the customer’s API developed in .NET to retrieve macroeconomic data provided by China state and province organizations.
Visualization and analytical tools were added to simplify data research. In addition to the visualization of different macroeconomic values, our developers enabled the creation of clusters to forecast future development in certain business clusters. Also, they added cluster ranking to facilitate the peer comparison of indicators across clusters.
Besides, the created service allows simple data customization by region, macroeconomic values (GDP, GDP per capita, average household income, etc.) and creation of personal dashboards. Graphics, schemes, and charts can be pinned to a
dashboard for each user individually. Besides, they can be printed out as is or downloaded as Data in Excel, PDF, JPEG or PNG.
The client-side of the system was implemented with the use of Backbone, Bootstrap, Highcharts and Underscore, Node.js, Phantom.js.
The server-side was built with the use of MongoDB, MongoJS, and Redis.
Project in Figures
Duration
man-hours

Applied Technologies


Result
Our developers’ work resulted in creating a web-based macroeconomic service that allows the visualization of a large amount of economic and social statistical data all over China.
The service provides up-to-date information on key macroeconomic indicators and also forecasts necessary for economic and investment research by economists, analysts, investors, corporations, etc. around the world.
The created service is user-friendly and touch-responsive. It works flawlessly on iOS and Android devices.