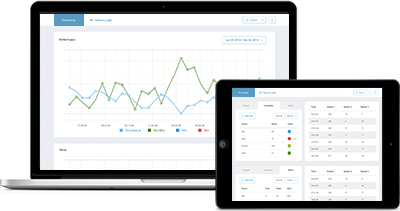
SensGraph – Online Data Visualization Prototype [Get Your Live DEMO]
 A highly customizable data visualization prototype that provides easily extendable capabilities, which allows us to build a web application cut to the specific client’s needs.
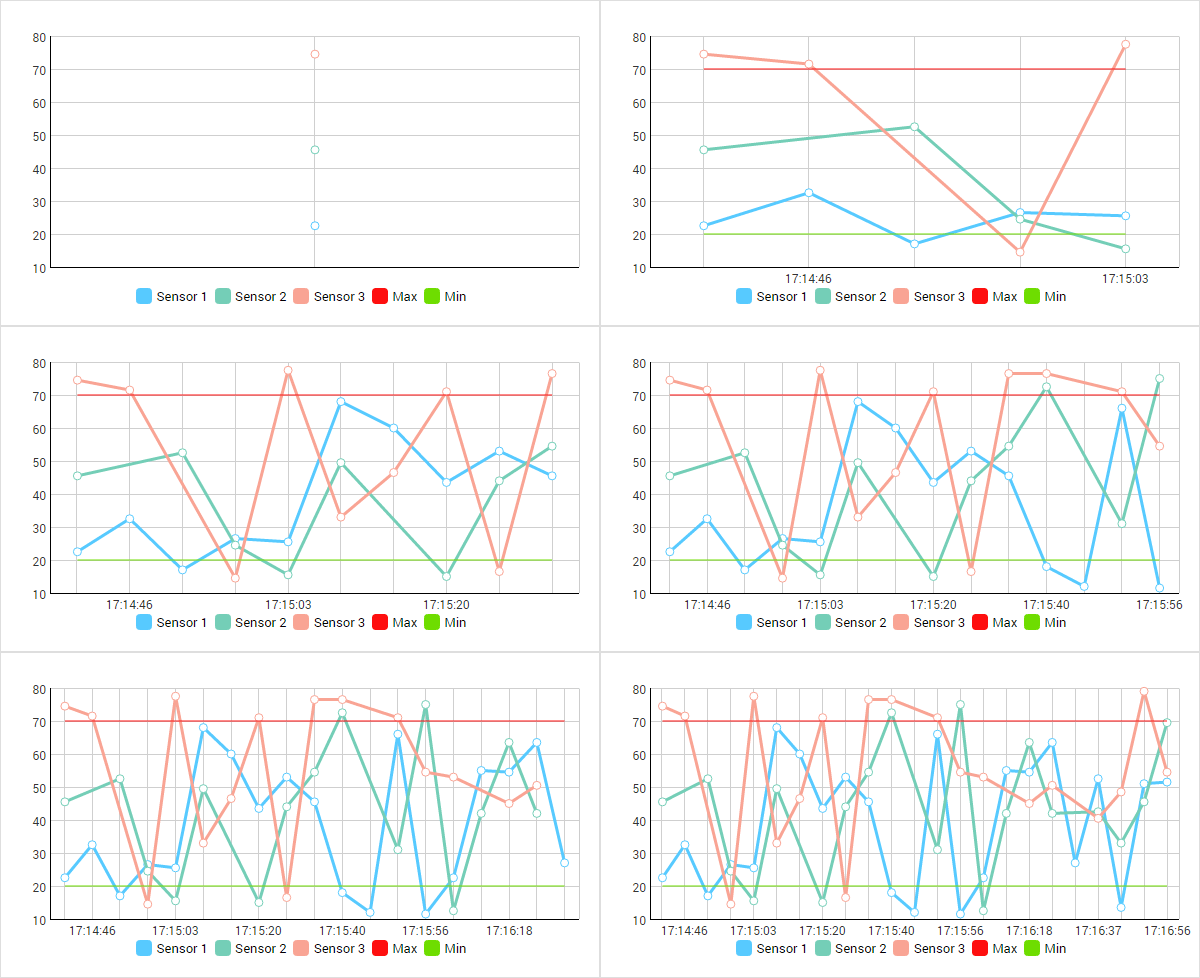
The created prototype simulates the behavior of a real web application for real-time visualization and remote monitoring of any data coming from sensors, PLCs or any other piece of monitoring equipment as well as from databases, webpages and desktop applications.
Based on this prototype, we can offer the development of a web app, integrate the created web app with your software, and provide any related technical support and training.
Key Features:
- Integrated high-performance charts, graphs and data tables
- Data rendering from systems, sensors, devices, etc. in digital dashboards
- Data support from multiple data sources
- High customization capabilities
- Immediate monitoring and visualization of data
- Automatic alerts triggering based on pre-defined configurations
- Fast data export in Excel and PDF formats
- Remote access from any PC or mobile devices through a web browser

I want this prototype demo!
XB Software is an outsourcing software development company that renders top-notch and cost-effective services in web app development, business analysis and quality assurance.
Contact Us