Economic and Investment Research Tool
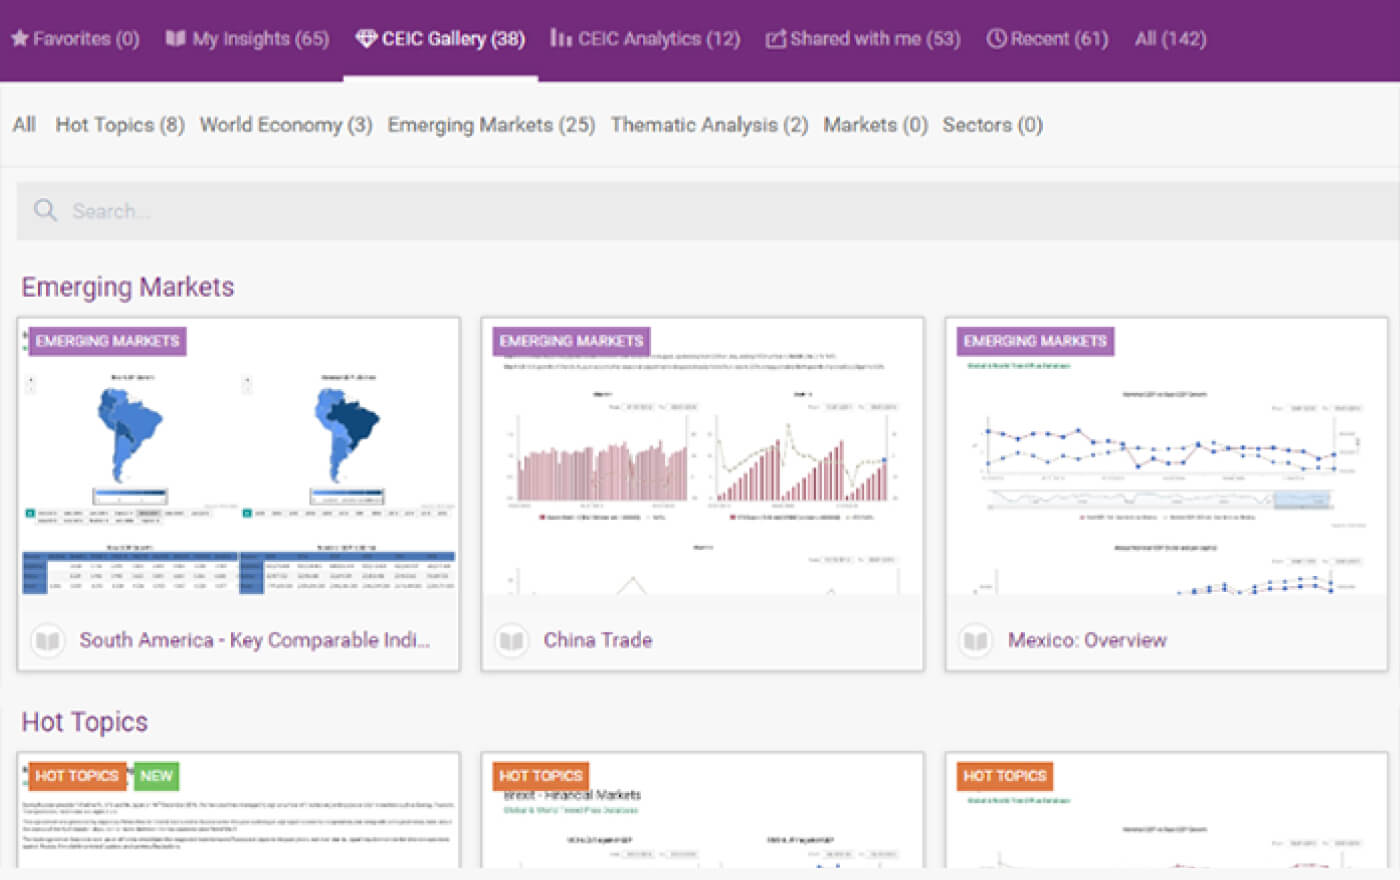
A web application for dynamic search and visualization of vast volumes of macro and micro economic information. It provides access to 4 million of valuable data series stored in one platform. The end-users of the tool are economists, analysts and economic researchers.
Business Challenge
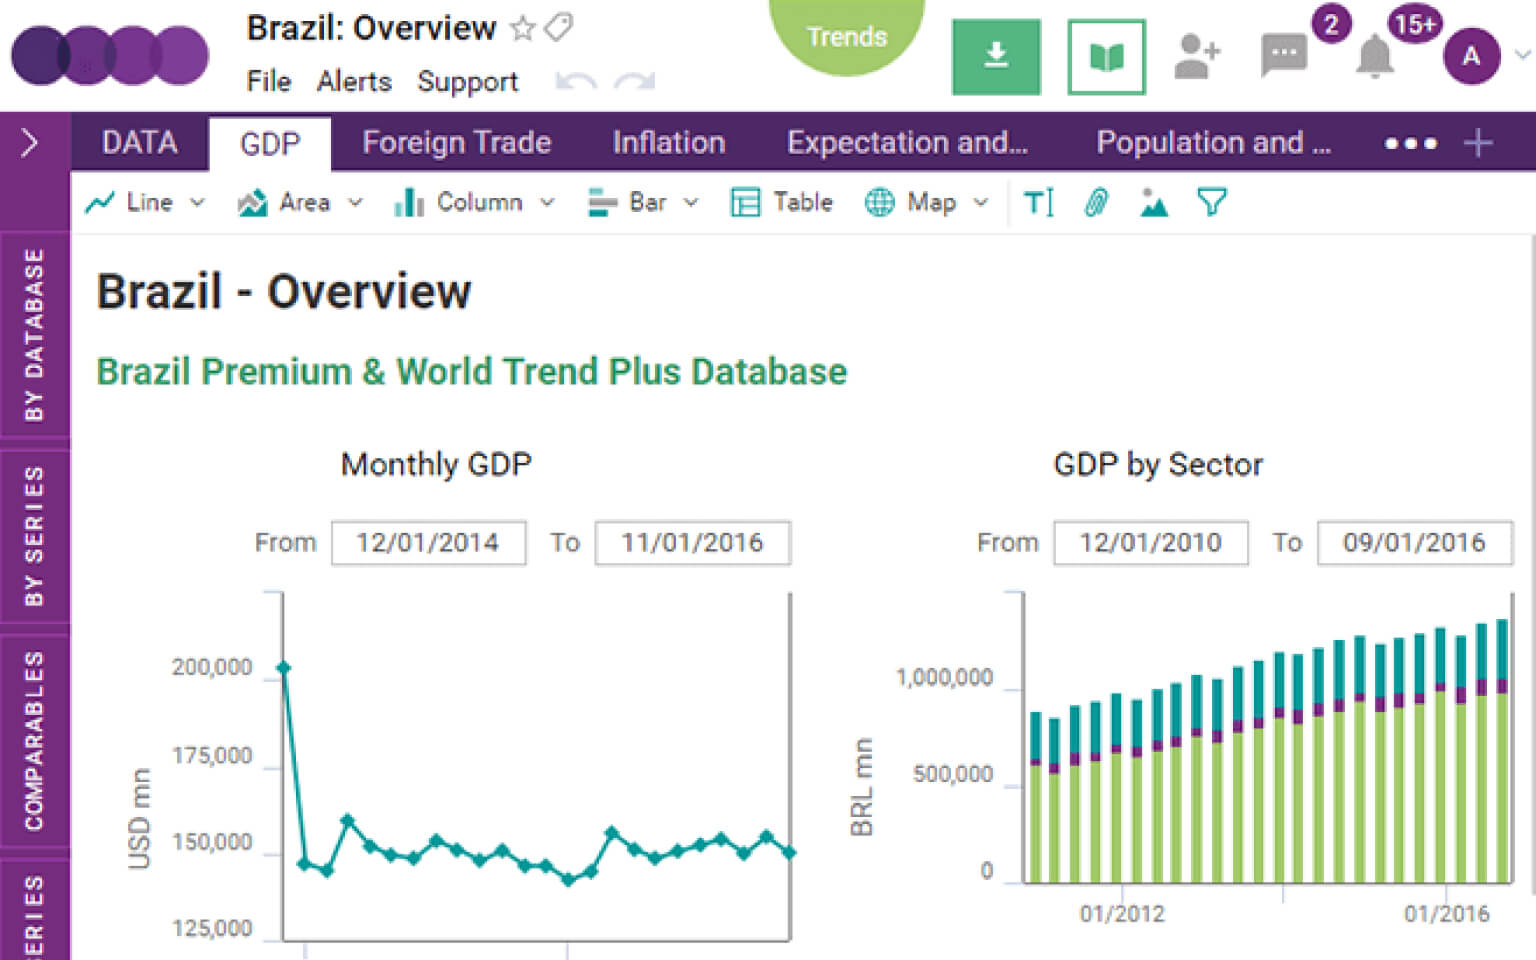
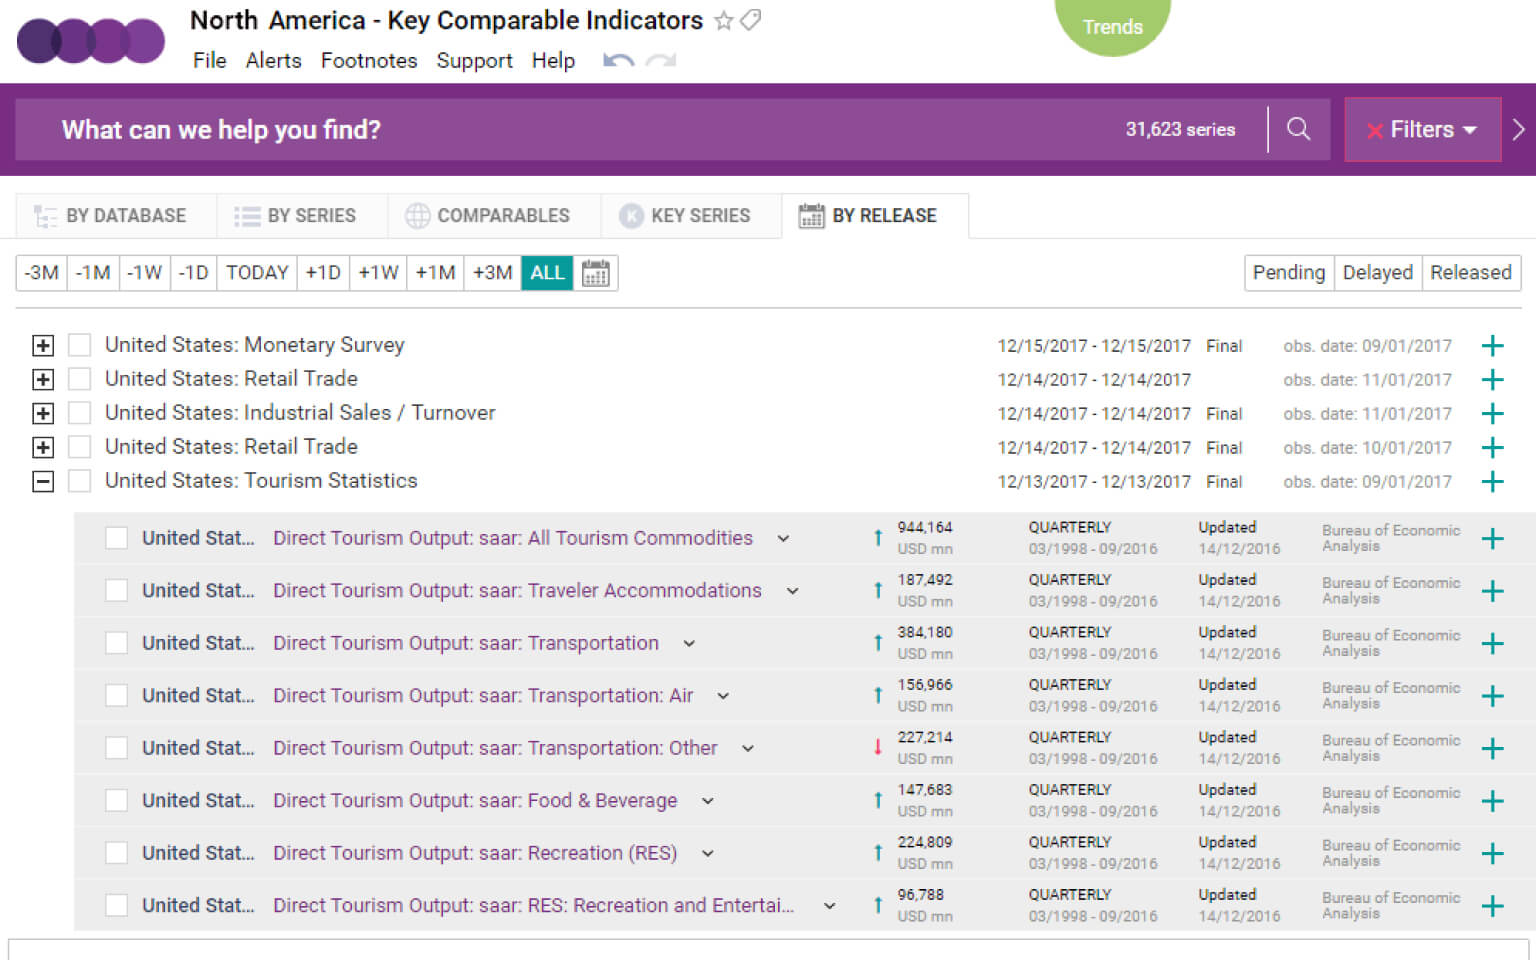
The customer required to build a powerful investment and economic tool with user friendly and flexible UI, rapid data search, and visualization of vast volumes of macro and micro economic indicators and other data in charts, maps, tables and diagrams. The tool was required to provide access to 4 million data series accumulated from 1,5K information sources and stored in one place.
The data series had to include most recent and historical data on macroeconomics, industries and financial markets of 128 emerging, frontier and developed economies.
The customer required the users of the platform to have not only access to trustful data but also create their own insights (workbooks) visualizing the selected information they need to help with their work.
The created tool was to replace the existing platform, improving its user experience and ensuring its high performance. The customer also requested the took to enable users work together over created insights.
Solution
XB Software specialists were challenged to create an easy-to-use platform featured by enhanced performance, improved data discovery and visualization.
To ensure the success of the developed product XB Software team included not only experienced web developers comprehending the most cutting edge technologies and QA engineers who took care of the product quality. Skilled financial analysts of XB Software were also involved. They had to classify both manually and automatically all those huge volumes of data series. Besides, they helped the development team in search optimization, which made possible the display of relevant information and as-you-type suggestions.
To meet the customer’s requirements to the product performance and UI, XB Software team specialists used the up-to-date techniques and technologies. The application is built with the use of the modern version of JavaScript (EcmaScript 6) to improve the code quality.
To provide high up-time different Amazon web services were used such as E2 and Spot Instances, S3, LoadBalancer, CloudFront, VPC, etc. Node.js was used as the main app server. Intermediate data caching was implemented with MongoDB.
Backbone.js was applied to build the client-side architecture of the application. To render a huge amount of data in a data table the team took Webix JavaScript UI widgets. MySQL was used as the main data storage. Java server was used to store and process vast volumes of data and run Math functions.
Redis was applied as the technology to process queues of data. Python was used to enable download to Excel and other formats of documents.
Solr enabled powerful search capabilities of the platform on MySQL and MongoDB levels. Phantom.js was applied to generate thumbnails and to download pictures of visualization components. HighCharts helped to build charts and diagrams in the application.
Gulp and Webpack were used to assemble the application and for deployment process.
SASS helped to create the beautiful frontend of the application.
WebSockets were used to enable collaborative work of multiple users. Microservices were selected as the main architecture pattern.
Interested in developing a similar solution or have your own idea in mind?
We are ready for any challenge, just contact us!

Project in Figures
30
Months
Duration
Duration
50000+
Estimated
man-hours
man-hours
Applied Technologies


Result
The result of XB Software team’s fruitful work became a powerful economic and investment research cloud-based platform, created in full compliance with the customer’s requirements. It is user-friendly, operates flawlessly on both desktop and tablet devices.
The platform provides rapid access to vast databases with deepest available macro and micro economic and sector data from hard to reach sources. The tool allows dynamic search and data visualization for more than 4 million data series. Moreover, app users can visualize their insights and create up to 15 views, choosing prefered style.
During the existence of the research platform, its user engagement has significantly improved in terms of avg.session duration, return visitors, and bounce rate.
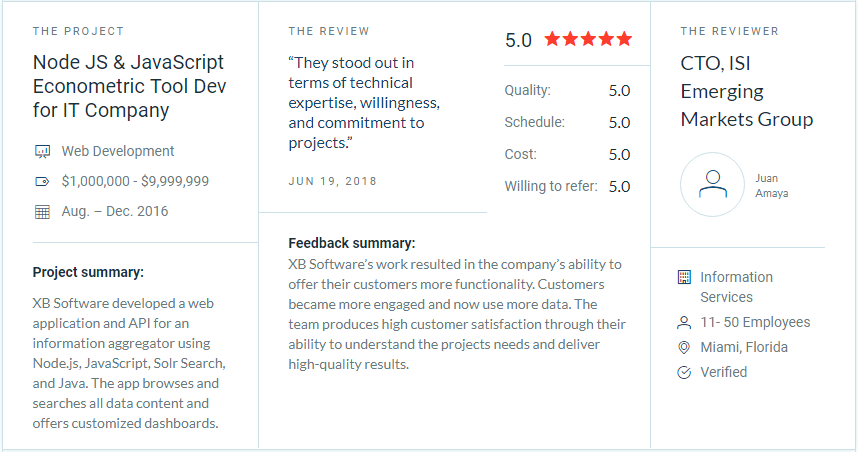
Reviewed by Clutch.co
Let’s Talk About Your Project
What's next?

Vitaly Hornik
COO at XB Software, Ph.D. in IT (Computer Science), PMP
We don’t just deliver projects — we build partnerships.
What's next?
Requirements
A sales manager will contact you to understand a vision.
01
Estimation
We provide a detailed plan, timeline, and cost estimate.
02
Agreement
We finalize the contract and begin working immediately.
03