Fast and Lightweight Grid Component Modernization for Salesforce
A full-featured and powerful tool for processing large amounts of data for Salesforce. The data grid component allows viewing on a single page of all necessary data to support a given business process. The grid provides a master-detail view which enables related data to be represented on the same view without the need to load multiple pages.
Business Challenge
Nowadays, any company, big or small, accumulates and processes large amounts of data such as in client databases, performance indicators, financial reporting and operations. To reduce unreasonable expenses for processing and monitoring heterogeneous data from different sources, many companies invest in automated processing and reporting. One of the most popular solutions on the market at the moment is Grid for Salesforce.
A company that specializes in increasing the value and ROI of CRM systems applied to XB Software for app modernization services. Our developers were asked to upgrade the Salesforce Grid component and create a comprehensive full-featured data grid that can load 30,000+ rows of data without pagination. The task was to provide the possibility to create custom views representing multiple related data sets. Also, users should have the ability to view, edit, add, and delete main or related records without page navigation. Another requirement was to implement the personalization feature that allows users to review the data they need via view templates. Users should also be able to create and save custom search queries.
Solution
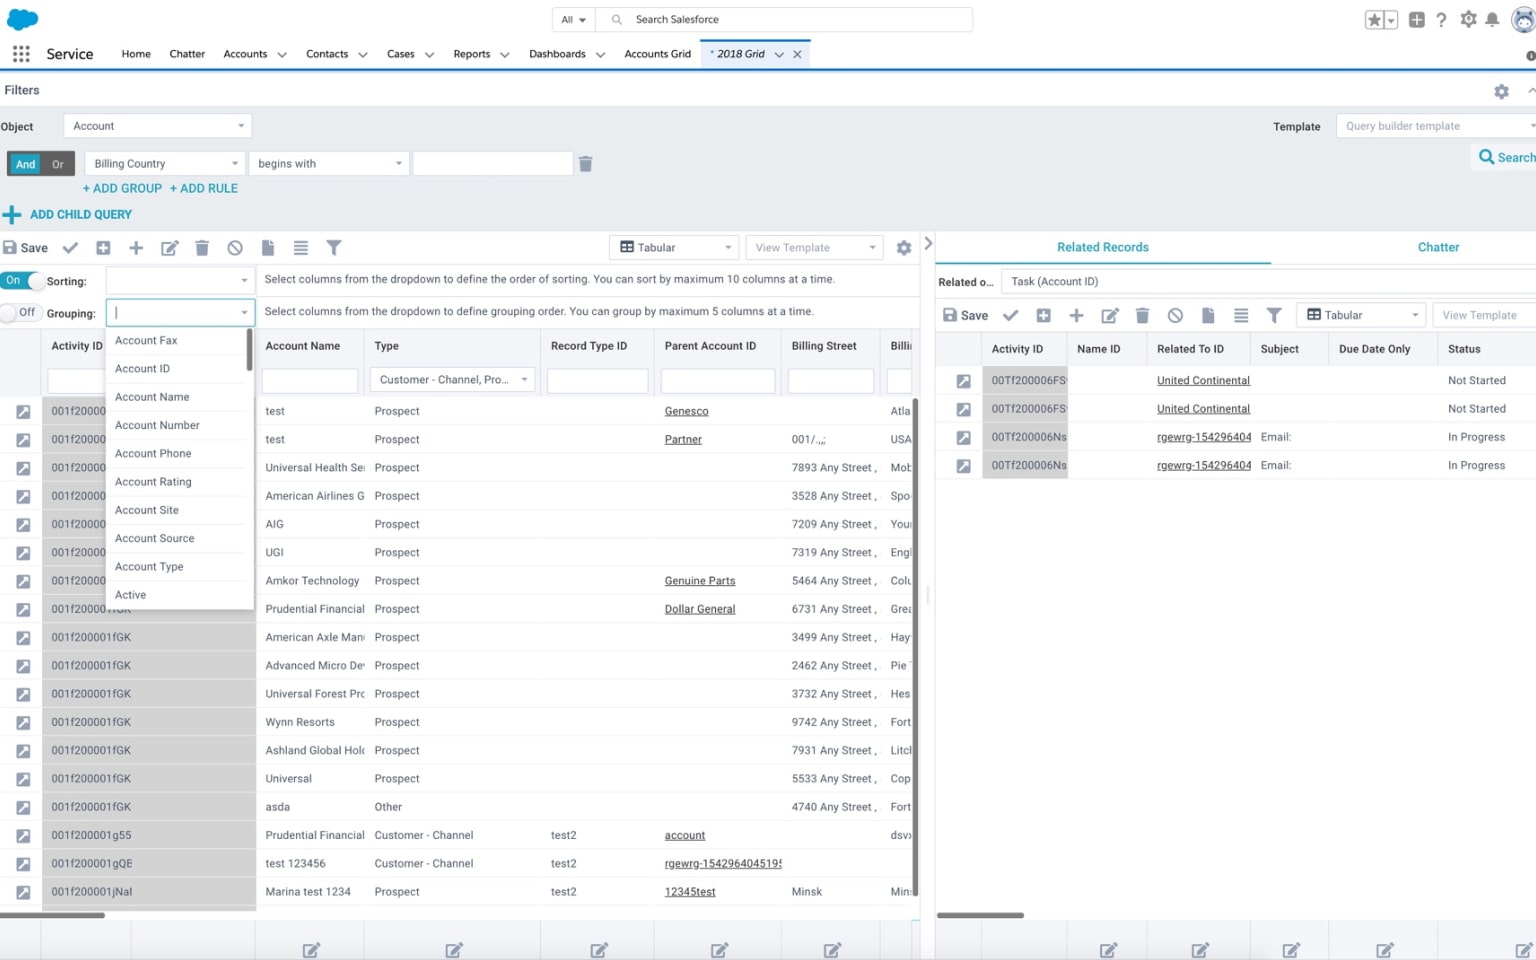
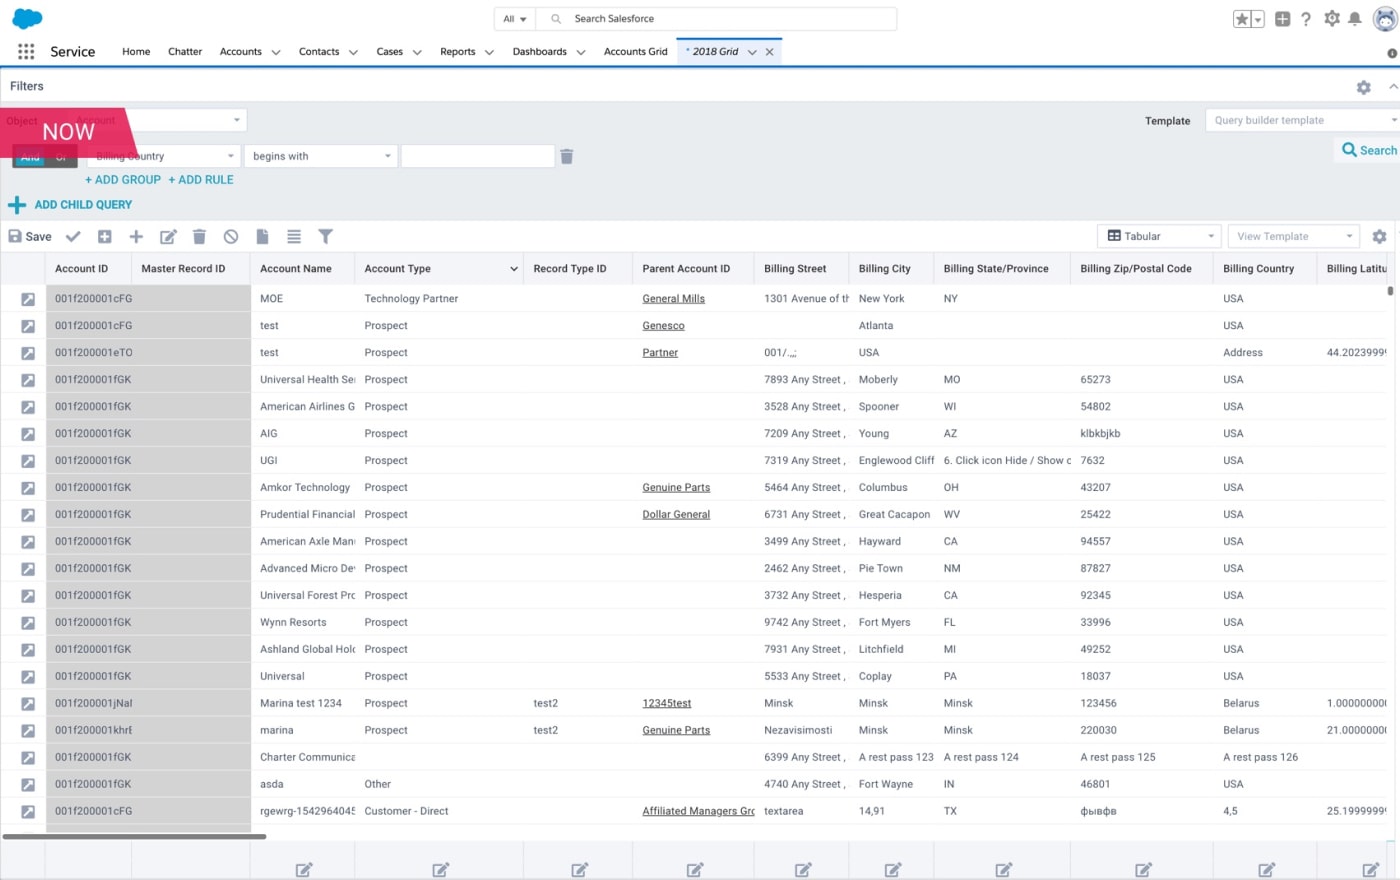
XB Software’s developers modernized the Grid component which allowed users to reduce the time and effort required to manage large amounts of data. The master-detail view represents related data sets in a single view. The app is optimized specifically for working with large amounts of data without the need to load multiple pages with records or open numerous forms at a time.
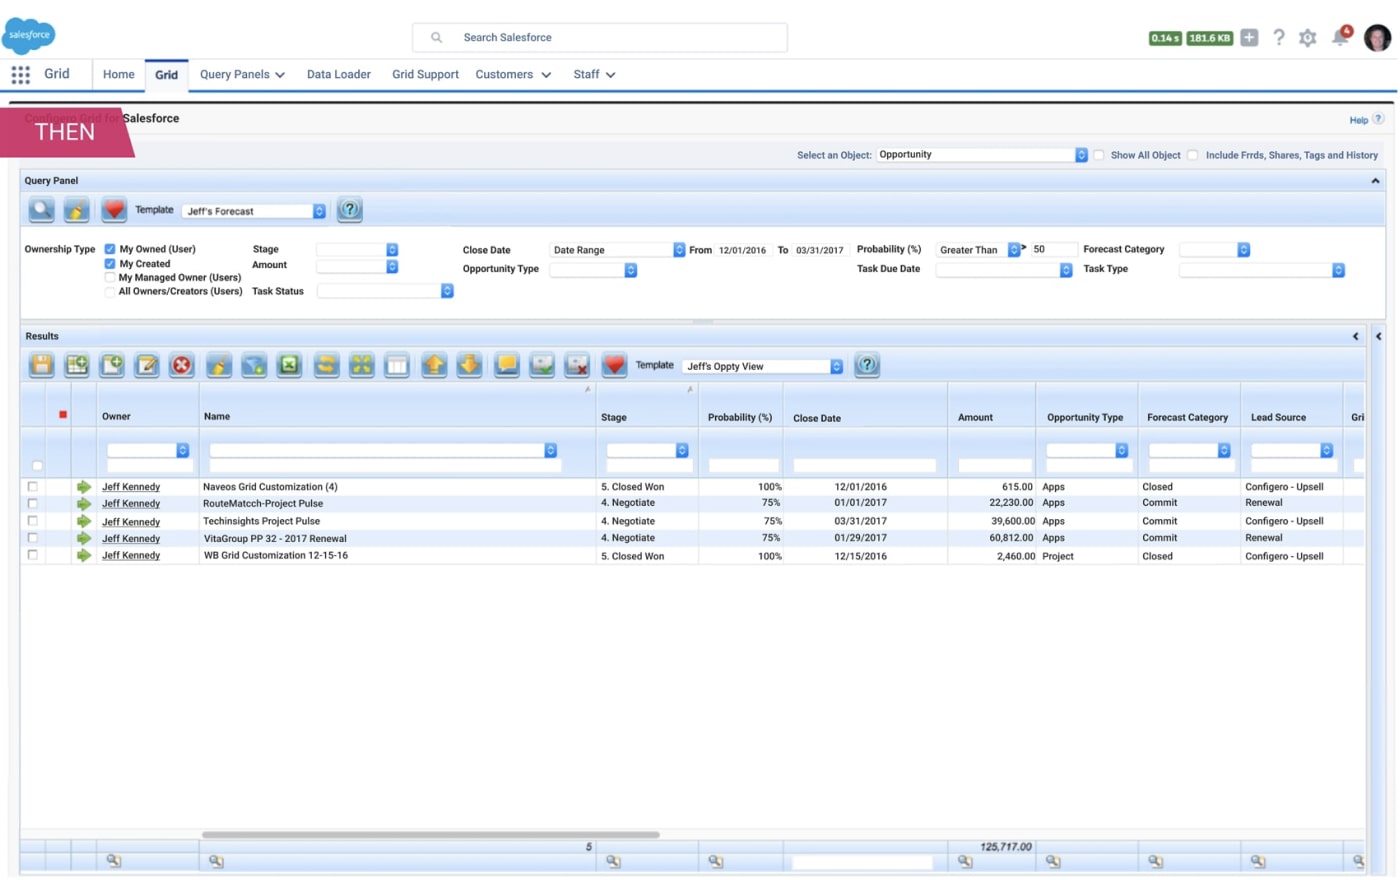
The query panel enables users to find and filter displayed data. Also, it supports complex searches. Personalization features allow users to configure the grid according to the needs of a particular user. All users can customize the grid to fit their needs better:
- choose what data to display
- dynamically create queries using an intuitive tree metaphor
- save templates for quick access in the future
Tabular view enables effortless viewing, grouping, and mass-updating of data. This view provides a user with a data table where columns are fields of the selected object, and rows are records of this object. The transposition view helps to reduce the effort of creating new records. Users can create multiple new records with a single transaction rather than adding them one by one. The transportation view can be used to create complex revenue forecasting and product management applications that work with a lot of related records.
The Grid provides users with the ability to present data in views that are optimal for the workflow being executed. DataTable, Pivot, Forecasting, Geo-Mapping and Spreadsheet views are all available.
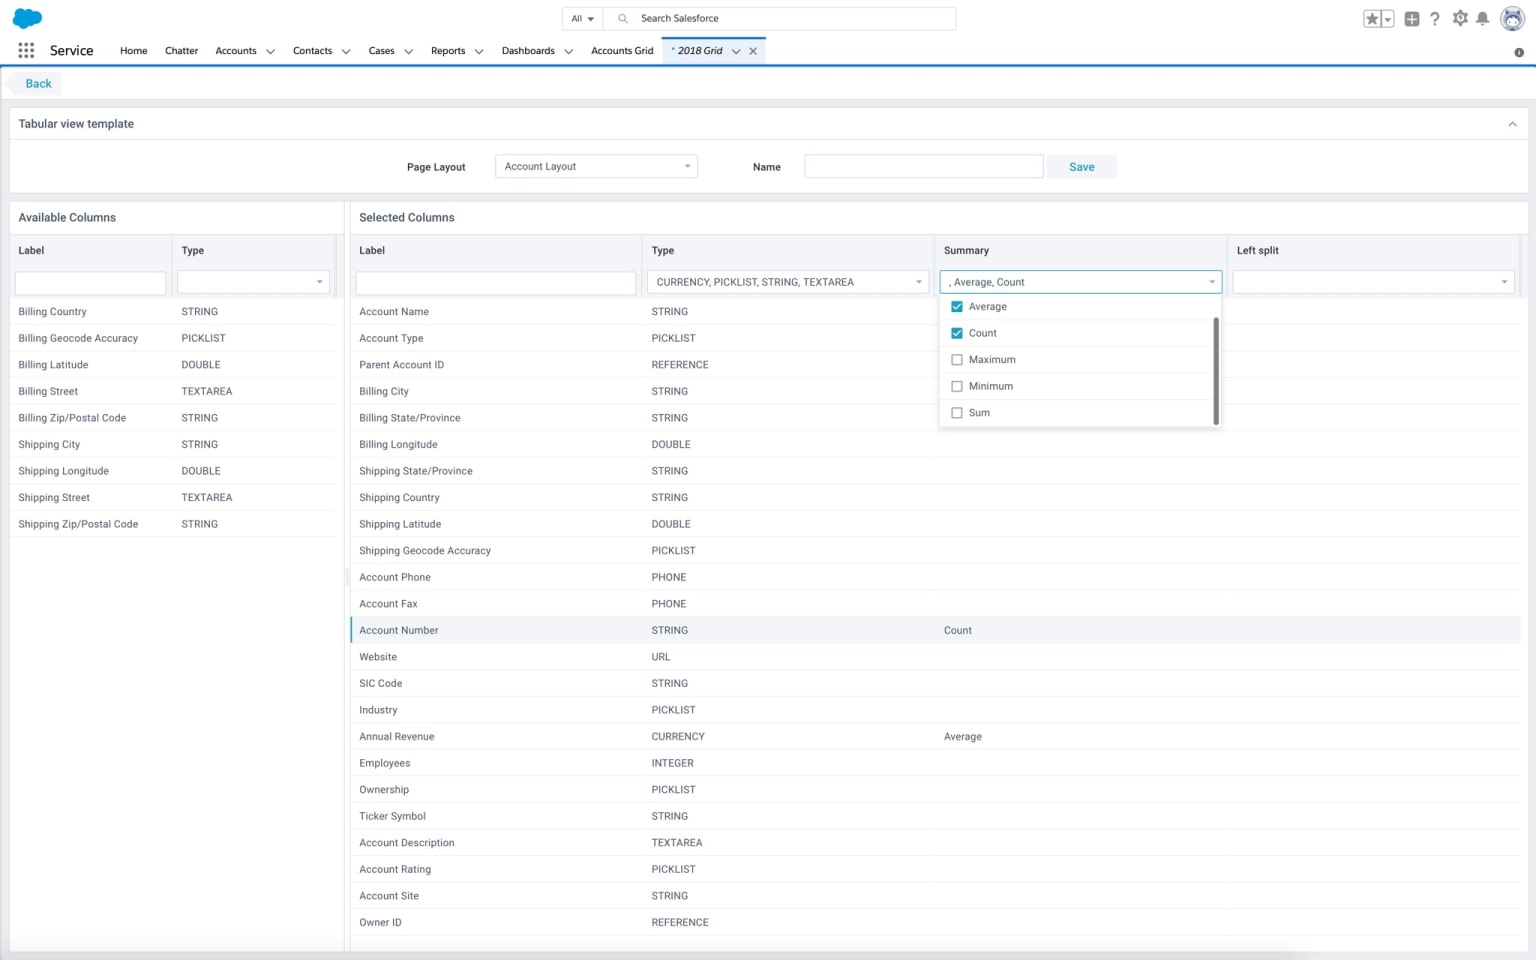
The Grid Wizard simplifies the creation of grids for a given use, case, or role which increases productivity and user adoption. Users can create highly optimized views to execute business processes using only the functionality they need.
To make the grid work flawlessly, even with an enormously big number of records, our Webix customization team used the Webix DataTable widget. It uses a lazy drawing strategy and draws only visible elements. Such an approach allows applications to work fast and remain stable whether there’s the need to render 100 or 100,000 rows.
Project in Figures
Duration
man-hours

Applied Technologies


Result
Our development team has created a full-featured data grid that allows dynamic filtering and updating of records with maximum efficiency.
This solution allows our customer to:
- significantly accelerate business processes
- increase collaboration and information sharing
- crucially reduce the time and effort required to manage data

