Complex Gantt Widget for Salon Management Software
From the usual widget to a tool of excellent visualization of operational activities and business processes. A complex ready-made Gantt chart widget that was customized for the implementation in the salon management software for the chain of salons.
Business Challenge
In today’s reality, businesses are increasingly faced with the need to process big data and try to visualize it for easier users’ perception. Most business systems are utilized to analyze data, make complex calculations, and deal with a lot of constantly arriving information. But there is a question: how to facilitate the visual perception of this information for a business and help to make quick and correct business decisions to optimize operations? And it is especially vital to find the answer if you are a business owner or an executive that needs to see the workload of your employees and manage the entire network of beauty centers you possess on a daily basis.
In the chain of beauty salons, there is a need to rent workplaces for specialists as well as to place advertising products. A beauty shop network can contain a quite large number of centers with even more workplaces and advertising stations inside, each of them having its own cost and rental terms. Any downtime in the rental time means business loss of profit and loss of business opportunities, as well as suboptimal use of funds. It can be hard to provide this amount of data.
So, the key challenge was to combine data detail with visual clarity. That is why we decided to use our complex Webix Gantt widget and help many of our clients who own a chain of salons by showing how it can be customized for an online salon management system.
Solution
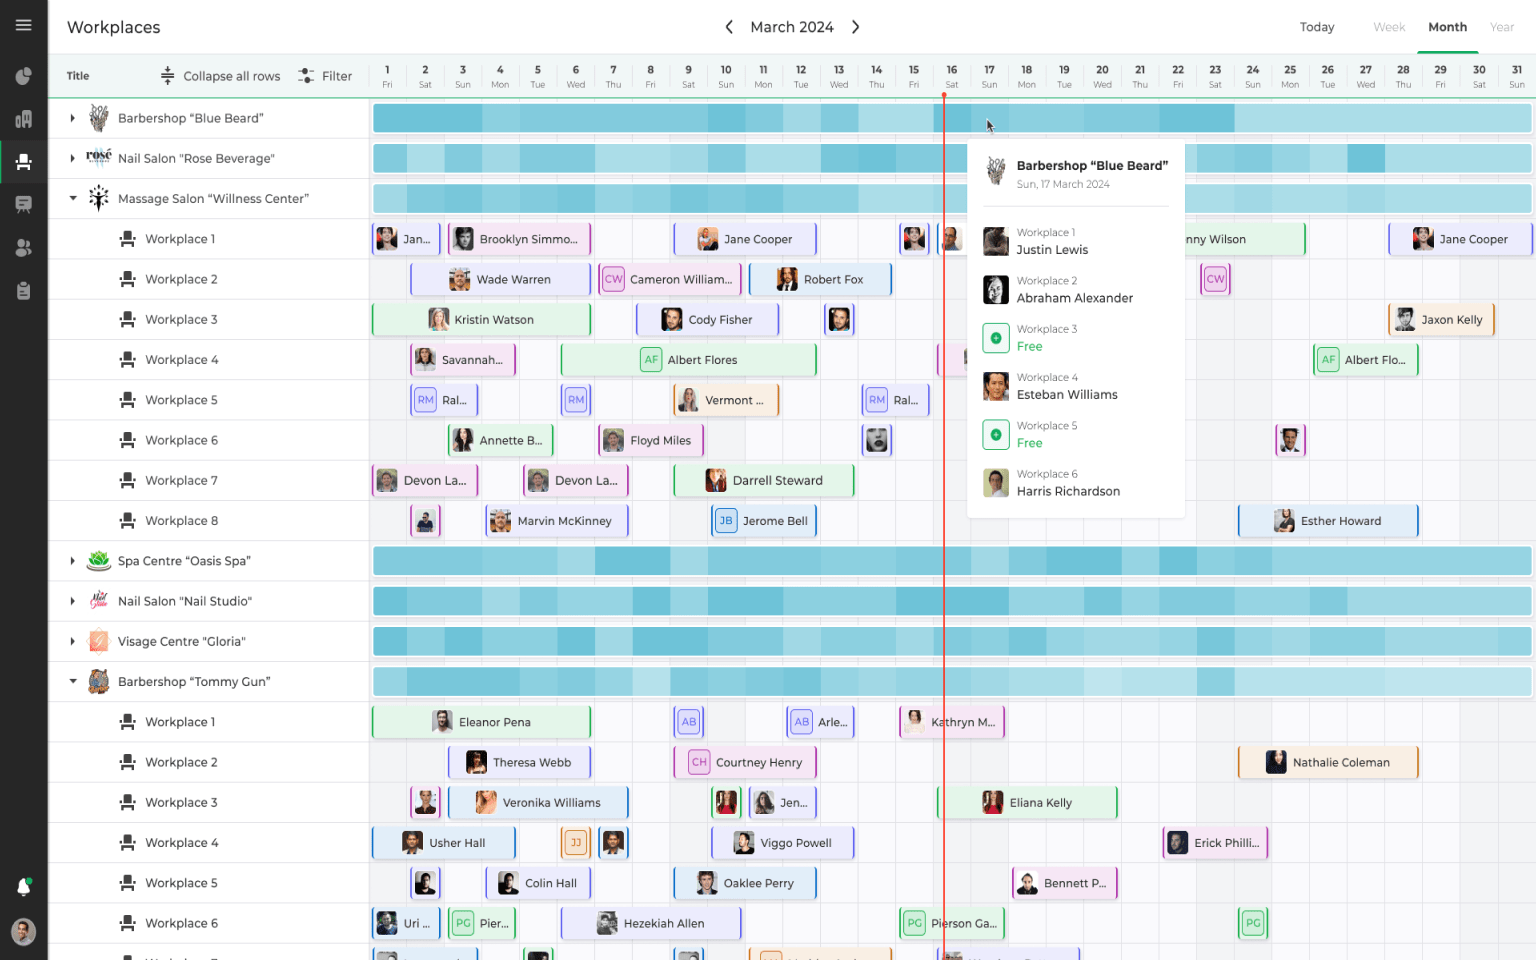
The development team was tasked with visualizing and optimizing these stations for each of the beauty shop centers. There was a need to offer a software solution that would simultaneously see the full number of workplaces and advertising station load for each of the beauty shop centers (companies), and at the same time, allow you to see a detailed picture of the loading of each workplace and advertising station in the form of a timeline.
You will say that the standard solution to the problem is a dashboard with visualized different graphs and charts by analytics and metrics. But the dashboard is aimed at displaying the overall picture, it does not give us enough detail in the section: a specific beauty center, a specific workplace, a specific time period. Or a particular beauty island, a specific advertising board, and a specific period of time. How many charts would have to be implemented? And what flexible settings should be implemented to allow for a new object to have a relevant analysis before your eyes? Too many questions with no answers.
Further, for us, it was absolutely obvious that creating a new widget from scratch makes no sense: it is often too long and expensive. What if we take a long-known and well-known Webix Gantt chart widget?
Complex Gantt JavaScript widget is perfectly suitable for such tasks. Using the standard version, we decided to develop a custom solution. Unconventional visualization problem was decomposed to the tasks:
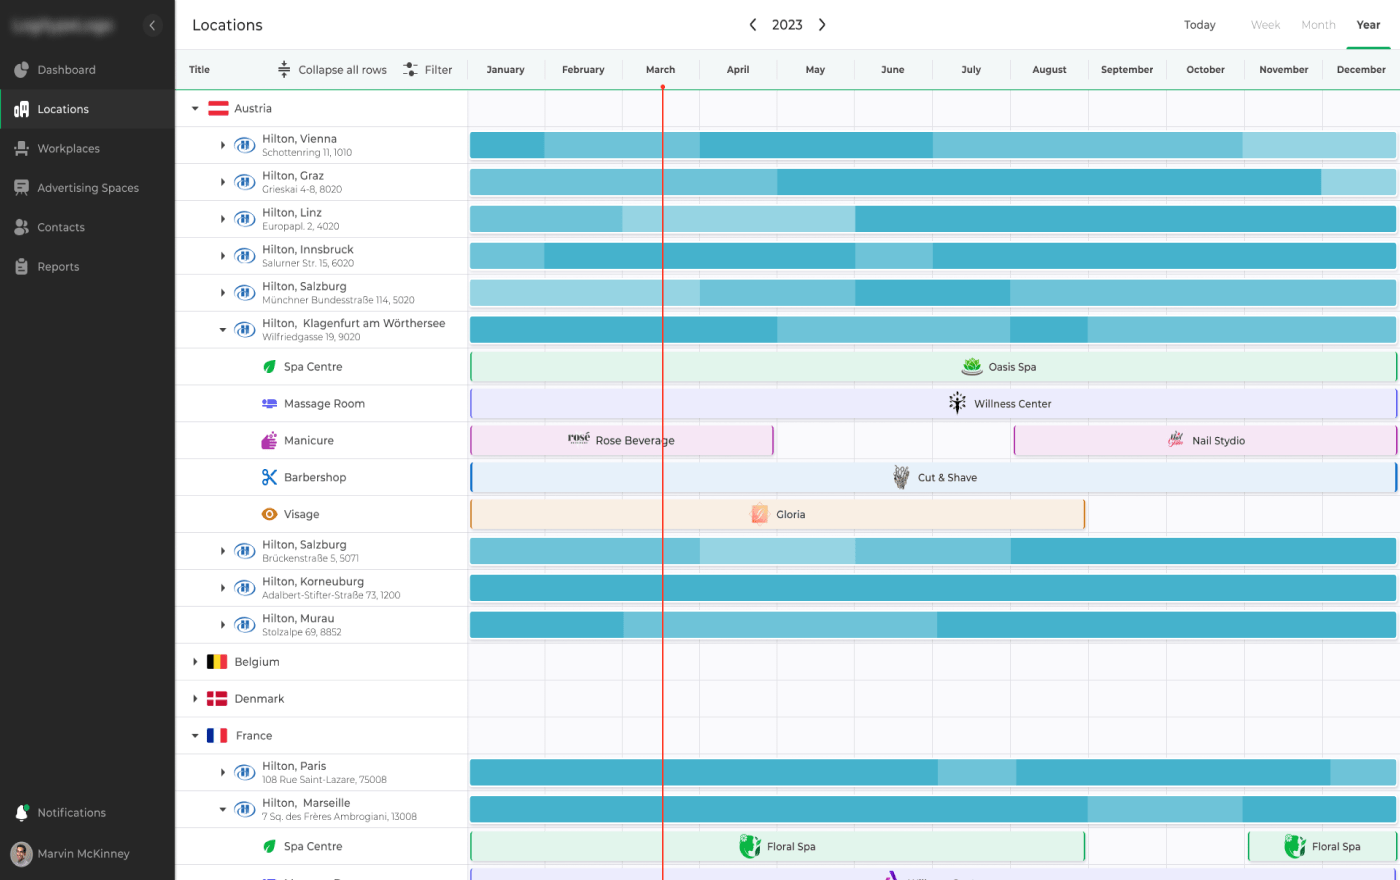
1. To place workplaces and advertisement stations from different companies on a timeline area. Physically, each of workplace and station depends on particular placement and period of renting (dates scale);
2. To decompose the data for better visualization. We had several beauty centers and the amount of data increased several times. So, firstly, data had nesting – a list of beauty centers with a list of workplaces and advertising boards inside. Secondly, as in reality it can be a large amount of data, it is better to load it in parts, and not in one piece. We understood that performance is a crucial moment for us and started to work with it.
3. To perform big data immediately, without time gaps. Initially, it loads a list of beauty centers. It does not immediately display information about the workplaces or advertisements boards on screens, but it can show the occupancy of the beauty center. Next, we open a branch – a beauty center, and load a list of screens related to this beauty center.
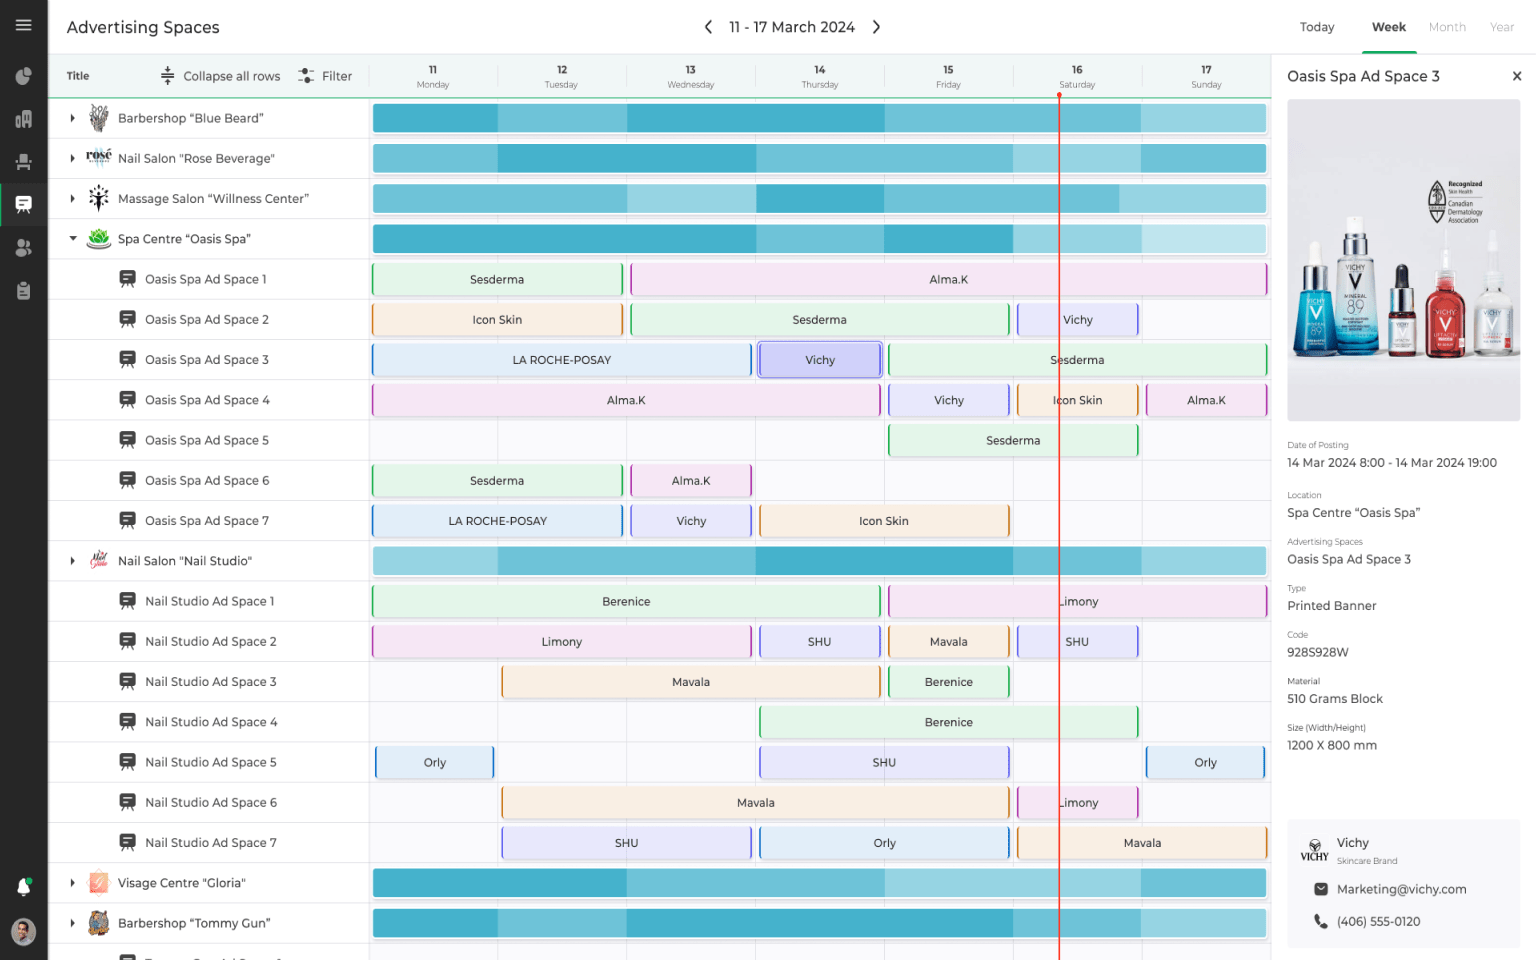
4. To visualize the totals and the details on the same screen. Hence no need to open each branch (beauty center) to see if there are any empty dates in renting workplaces (or advertisement boards). The branch shows it by colored areas on the bar: from 100% occupancy of all stations during the day (week, month) that has a deep color to occupancy less than 100% colored with the lighter tone. The days with the lightest areas on the bar are to be optimized, as denote equipment or space downtime.
5. To specify the data during global data visualization. Additional filters help to display the needed data on one specific screen, on the type of screen used in different beauty shops (if there is such a type), or on a specific company.
After developing these tasks, we’ve got the solution. This kind of customization is really universal. It can be used not only to solve the above problems, but can also be used in other business domains, which have the need to quickly track operational processes (rental, workers, service, etc.). For example, it can be useful for:
- beauty shop chains (hairdresser, barber shop, manicure services, stylists, etc.);
- shopping malls and centers;
- massage and manicure rooms;
- co-workings of any complexity (beauty, dental, workplaces for IT professionals, etc.);
- car service stations;
- medical centers;
- rental agencies for commercial real estate and offices;
- advertising agencies with advertising platforms (billboards, transport, buildings, commercial premises);
- companies that are engaged in the rental of equipment (coffee machines, furniture, etc.);
- visualization of work processes of project management classically helps to improve team interaction, organize and track the tasks of each participant.
Implemented Components
In order to boost the software development process, we often use our products (Webix, DHTMLX) that are also used by our customers afterwards to simplify the work with their systems.
Webix Gantt chart widget is a useful component for any project management software, so in case of using it for the chain of salons, it can be a great asset in improving the management process. Its rich functionality allows managing online bookings and resources, creating any number of tasks, and monitoring their execution. Therefore, it was a marriage made in heaven.
Project in Figures
8+
Months
Duration
Duration
1350+
Estimated
man-hours
man-hours
Applied Technologies

Result
With the help of casual configuration settings, Webix Gantt chart widget can be transformed to the needs of different business cases. To help our customers better understand its abilities, we created a free demo version of a basic functionality. The demo shows that by setting the base config, you can easily embed the Gantt widget into any project and immediately test its basic features, and then, step by step, modify any part of the widget, add new functionality, and experiment.
Fill the form to get a no obligation consultation from our experts
Your questions and requests are always welcome