Legacy App Modernization for TV Tower Data
Modernized web application for the company in the Telecommunications and Broadcasting domain with up-to-date front-end, improved interface, and robust data visualization tools. The new system enhances operational efficiency and provides real-time insights, enabling better decision-making.
Business Challenge
Modern technologies are rapidly developing and many companies often face the need to update their outdated applications to enhance functionality and improve user experience. These improvements help to enhance their functionality and make it more user-friendly and attractive.
A client from the Telecommunications and Broadcasting industry asked us to help with the modernization of the app their company has been working with. The application visualized data from specialized television tower transmitters (TV equipment and sensors), and it was utilized in TV media for control management of those facilities. The data was collected and displayed to the engineers back on the studio locations on the desktop devices. The client wanted to transform the company’s desktop telecommunication application into a web software with a modernized interface.
This project was quite specific and challenging because the original application was created in 1989 and last updated in 1996. The original system was developed using C++, and was only specified for installation on desktops for Windows OS. It became outdated despite its rigid and very strictly limited functionality and not so feasible for new users who had experience in working with flexible and modernized applications. As a result, the client began to run into several issues:
- an interface that did not meet current UX/UI standards;
- limited data visualization capabilities;
- the absence of mobile device adaptation.
Faced with these challenges, they sought out legacy application modernization services and ultimately chose our company, recognizing our expertise in this area, to help them navigate this transformation.
Solution
The client wanted to leave the database and business logic of the telecommunication system as it is, but deal with the occurring issues. Together with the client’s team, our Business Analysts estimated the following tasks that need to be done: migrate the application to AWS cloud storage, update the front-end using modern technologies, and enhance data visualization from sensors using a suitable UI library.
After the transition to AWS cloud storage was done on the client’s side, it removed the necessity for desktop installations and significantly simplified the use and maintenance of the system. Besides that, the process provided higher availability and scalability of the software. Amazon EC2 was used to deploy the server part and Amazon RDS was utilized for database management. This setup provided us with robust capabilities to handle large data volumes effectively, ensuring optimal application performance.
Our particular goal was to take the second and third tasks and modernize the user interface, making it functional and adaptive to meet the needs of current users. Thus, the specific tasks required from our side included:
- Developing a new vision for the user interface based on key features;
- Implementing a up-to-date front-end framework;
- Ensuring interface adaptability across different viewports;
- Integrating robust data visualization tools.
The preparation phase for the new interface proceeded seamlessly, incorporating straightforward visualizations to highlight data priorities. Our team focused primarily on updating the front-end.
The application should have display the data, which included information received from telecommunications towers regarding:
- Power supply connection. This refers to the status and quality of the electrical power being supplied to the telecommunications tower. The users should have seen the detailed information on whether the tower is connected to the power grid, the voltage levels, and any backup power sources, like batteries or generators.
- Data from temperature sensors. These sensors monitor the temperature within the telecommunications tower and its equipment. This data helped employees to ensure that the equipment is operating within safe temperature ranges to prevent overheating and potential damage which may affect the signal.
- Wind force. This data measures the wind speed and direction around the telecommunications tower. High wind speeds can affect the stability and integrity of the tower signal, so monitoring this should have helped in maintaining safety and operational efficiency.
- Signal frequencies. This includes information on the various frequencies being used by the tower to transmit and receive signals. Users should be able to manage the spectrum and ensure that the tower is operating on the correct frequencies without interference.
- Free slots for connection. This refers to the available capacity for new connections or devices that can be supported by the telecommunication tower. Visualizing this data properly would have indicated how many more users or devices can be connected without overloading the system.
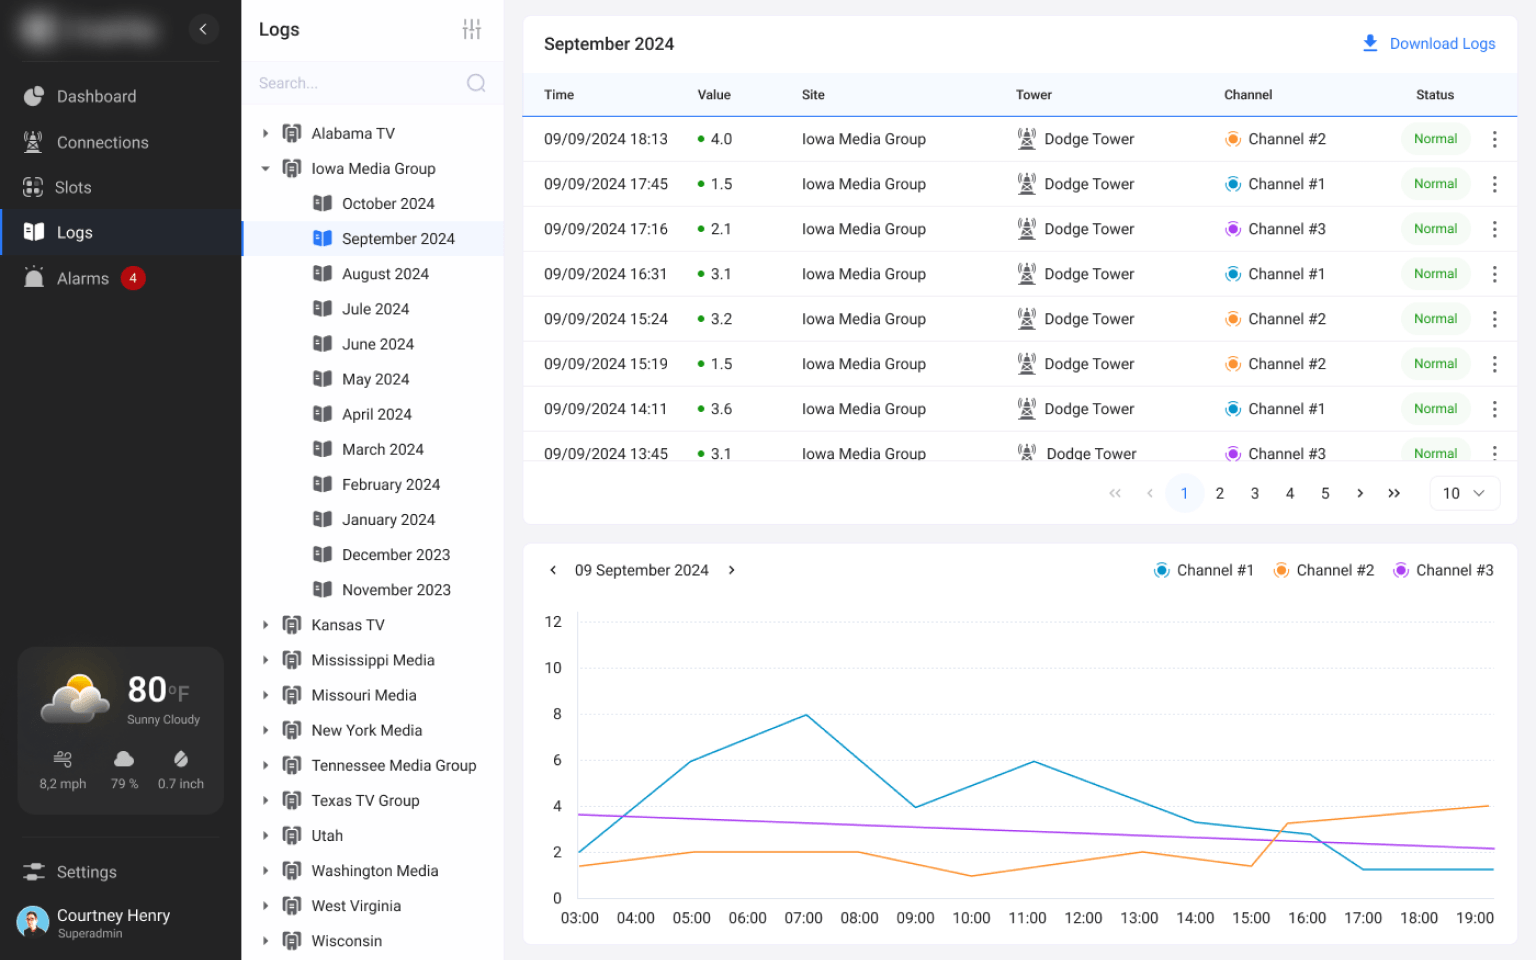
Besides that, we considered that possible graphs for displaying the information should have a number of user settings and display types. Also, it should be possible to save data from sensors in logs and to display history for an arbitrary period required by the user. In case of a permanent connection for long-term and continuous signal transmission, the user should be able to configure the type of notifications with warnings.
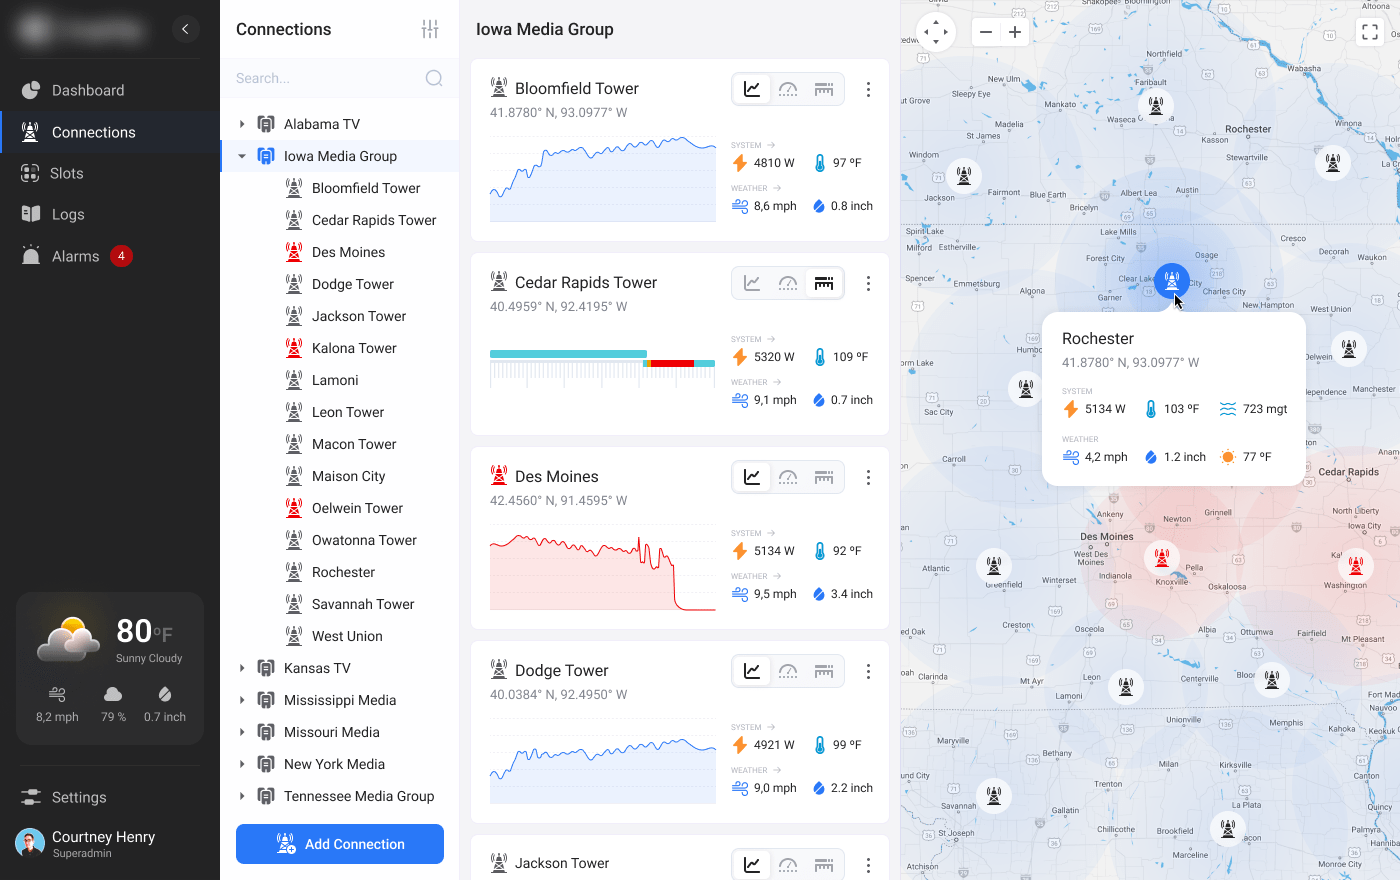
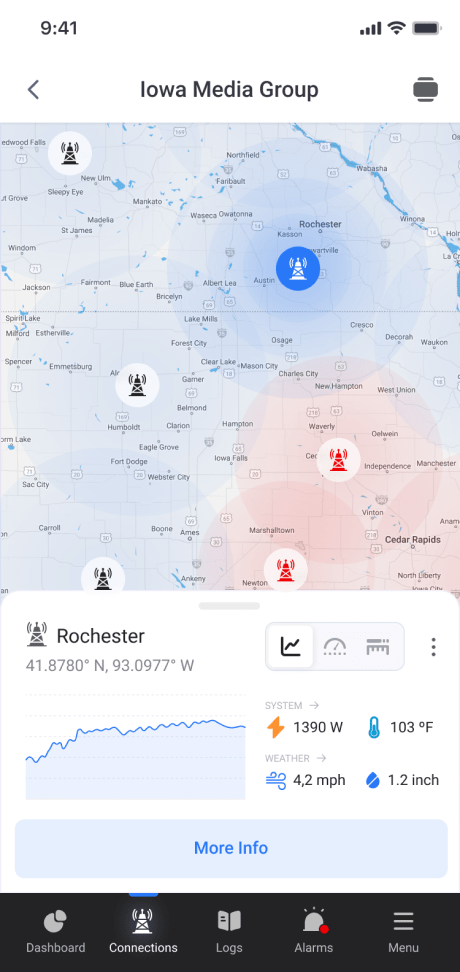
Thus, our task was to efficiently visualize all the data considering all the customer’s requirements and needs. To help users to understand and monitor the needed data effectively, it was decided to visualize a dashboard with a map. The application should show all the critical details on the tower location, connection status, etc. in order to allow users to make better decisions.
Our challenge was to create a comfortable user experience to satisfy those who have been using this application for decades but make it up-to-date to avoid pushing away new users. We paid attention to the intuitive interface that adapts to user actions, and the method paid off.
Front-End Update
The second key task was to update the application front-end, and this is when our team steps back in. Initially, it was considered using ReactJS as one of the widest known technologies with a huge supporting community. But, in the process, the customer preferred to swap from ReactJS to Angular2.
Technologies
All in all, Angular2 was preferred over ReactJS for this project due to several factors:
- required performance,
- reference to API peculiarities,
- the ability to develop complex and dynamic user interfaces.
With the help of Angular2, we were able to have powerful tools for developing and testing the telecommunication application, significantly reducing the time needed to create a new interface.
The component-based architecture and two-way data binding of Angular2 were particularly beneficial for creating interactive and responsive elements. This allowed building more effective data visualization tools and user interaction. Additionally, the comprehensive structure of Angular2 helped to reduce development time significantly. Overall, its capabilities aligned well with the project’s goals, making it a more suitable choice.
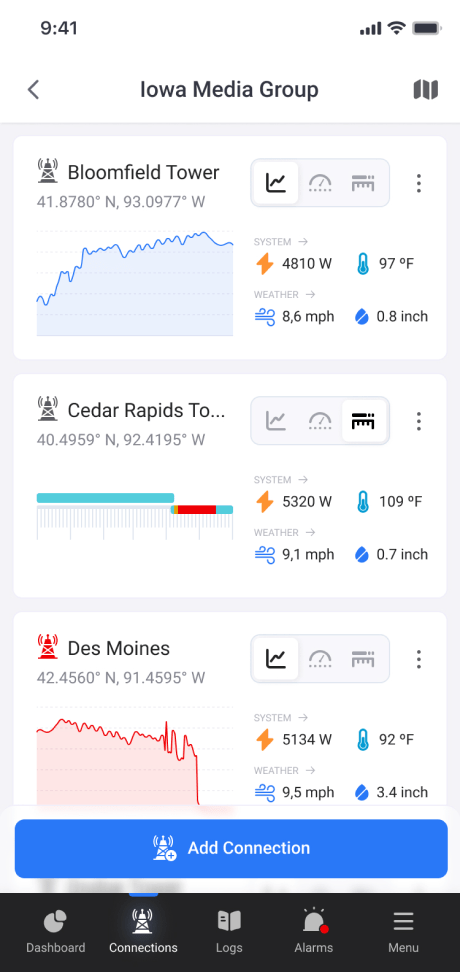
Adaptive Layout
To ensure convenient use of the system on devices with different screen resolution, we added an adaptive layout. This made the application’s interface flexible and convenient for both desktop and mobile device users.
The adaptive layout ensured the correct display of all interface elements in an appropriate way and improved the overall user experience. We applied present-day approaches and technologies, such as CSS Grid and Flexbox, allowing us to develop complex and flexible layouts. Special attention was paid to testing the interface on various viewport sizes to coincide with different devices and browsers to ensure its correct functioning in any conditions.
Using the Kendo UI Library
To display the data from data sensors, we chose the Kendo UI library. First of all, the client recommended this technology after their own positive experience working with it. Their decision was based on its rich functionality and extensive data visualization capabilities. Thus, the library offered many ready-made components, such as gauges, charts, and diagrams, which significantly simplified the development process and allowed us to create an intuitive and functional interface.
The availability of a large number of preset themes and the ability to flexibly customize the appearance of the components was another key factor in choosing Kendo. This allowed us to design a modern and attractive interface that meets brand requirements and user expectations.
Dynamic Data Display
Updating the dynamic data visualization on the report page was another important aspect for us to consider. Therefore, we implemented the ability to develop custom charts, allowing users to customize the data display according to their needs. This solution significantly improved the usability of the telecommunication application and provided more opportunities for data analysis and visualization.
To implement this functionality, we implemented Angular2 capabilities for creating dynamic components and integrated with the Kendo UI library. This allowed us to design a flexible and powerful data visualization system that easily adapts to any user requirements.
Project in Figures
6
Months
Duration
Duration
1100+
Estimated
man-hours
man-hours
Applied Technologies


Result
App modernization is a complex and responsible process that requires deep knowledge and experience. As a result, our work exceeded all the customer’s expectations. The updated telecommunication application became much more functional, convenient, and up-to-date.
The project was successful thanks to the coordinated work of the team and the use of current technologies. We also received positive feedback from the customer who noted the convenience of using the new interface of the system.
- Intuitive interface with adaptable layout. Transitioning to AWS cloud storage ensured high availability and scalability and using Angular2 with Kendo UI allowed us to make a powerful and intuitive interface. The adaptive layout ensured the correct display of the telecommunication and broadcasting application on various devices, and the dynamic data display gave users more opportunities for data analysis and visualization.
- High performance and reliability. We developed a functional, convenient, and modern application that meets all the requirements of current users and ensures high performance and reliability.
- Enhanced real-time data access. Integrating real-time data visualization tools enabled the client to monitor and manage their television tower transmitters more effectively, leading to better decision-making and operational efficiency. For instance, it became possible to promptly address signal degradation or equipment malfunctions, reducing downtime and ensuring consistent broadcast quality.
- Cost efficiency. Transitioning the system into a web-based application reduced maintenance and operational costs associated with software updates and hardware requirements.
Fill the form to get a no obligation consultation from our experts
Your questions and requests are always welcome