Software Demos
We provide a variety of demos made based on the ideas we had in mind for our clients across different industries. If you can’t find the demo you need or want to see the full list of services we offer, you can contact us to know more.
We understand that choosing the right software solution for your business can be a daunting task. Instead of searching for ready-made systems with irrelevant features, we offer you to try our demos that are designed to simplify your life and provide you with concrete examples of specific systems you can create. If there is a demo you like or you want to develop a similar application, our experts are ready to follow your requirements. We stay up-to-date with technology trends, so you can be sure that we will offer you solutions and features that will be the best in your particular case.
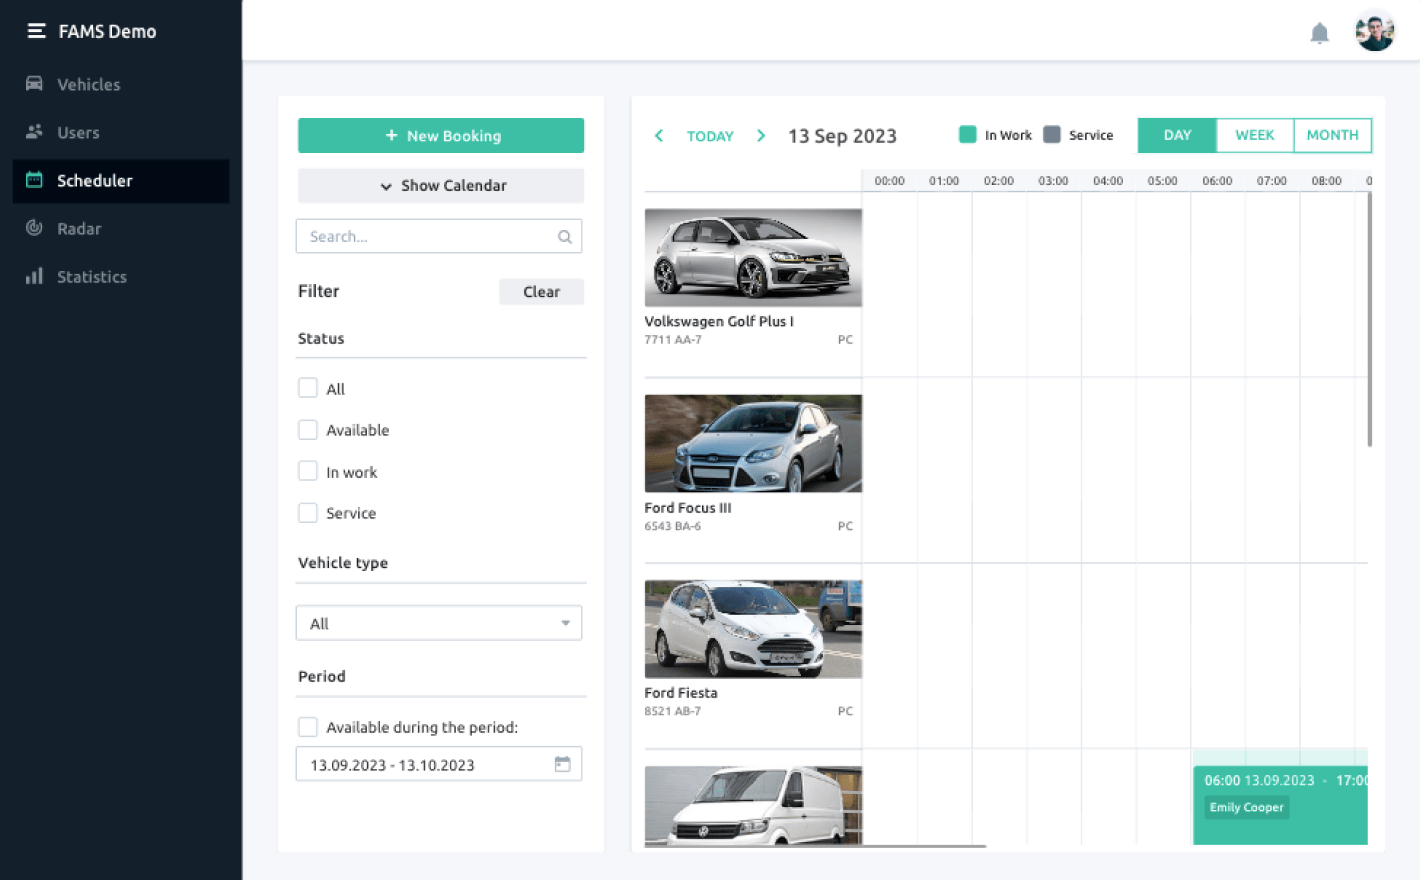
GPS Tracking & Fleet Management System
This GPS tracking and fleet management system demo shows how to make the monitoring and managing of the drivers performance, routes they take, and condition of their vehicles easier.
GPS transport tracking and incidents control
Estimated time completion
Maintenance scheduling

Check Detailed Demo Videos
Choose a demo you want to try and fill the form!
Let Us Prove Our Solution Will Work For You