Summary
While companies accumulate vast data stores, traditional BI tools often fail to turn this information into insight. This article explores how custom data-driven platforms serve as tailored interfaces that connect raw data and AI outputs to human decision-making workflows. Discover how bespoke visualization and interaction layers transform complex data into confident business decisions.
The explosion of enterprise data not necessary translates into better business decisions. In practice, many companies now have sprawling data lakes, warehouses, and even AI/ML pipelines, but struggle to turn that data into action. Data by itself has limited value unless users can understand it and act on it. The real bottleneck isn’t the data or even the AI models, but the way people interact with them. This article explores how custom data-driven platforms can bridge the gap between raw data and confident decision-making.
Big Data Challenges in Mid-Size and Enterprise Companies
Many mid-size and large enterprises collect data from dozens of sources, such as internal systems, external feeds, on‑prem and cloud databases, sensor streams, and more. For example, one our client had to consolidate 4 million data series from 1,500+ sources. In theory, having all this data is great. In reality, it often creates fragmented silos and integration problems:
- Multiple Systems and Silos. Different databases and data lakes rarely talk to each other natively. This fragmentation forces analytics teams to spend huge effort on ETL (Extract, Transform, Load) and ELT (Extract, Load, Transform) just to unify data;
- Massive Volumes of Diverse Data. Organizations now handle terabytes of structured data and even more unstructured data (logs, documents, images). Managing this at scale is a “big data challenge”, as it takes high-end technology just to store and process it;
- Disconnected BI and Workflows. While internal analytics and data science teams may produce models or dashboards, business teams often can’t use them directly. In many companies, analysts resort to downloading data into Excel or Power BI and manually slicing it.
Read Also Dangers of Data Silos And Efficient Strategies for Eliminating Them
Why Off-the-Shelf BI Tools Are Often Not Enough
Modern BI tools excel at creating dashboard snapshots, scheduled reports, and canned visualizations for known KPIs. However, by design they often work best for retrospective analysis and fixed data models. There are important limitations when trying to use them as the sole decision-support layer.
Read Also How Data Intelligence and Data Analytics Differ From BI and BA and Why They Matter
What Is a Custom Data-Driven Platform?
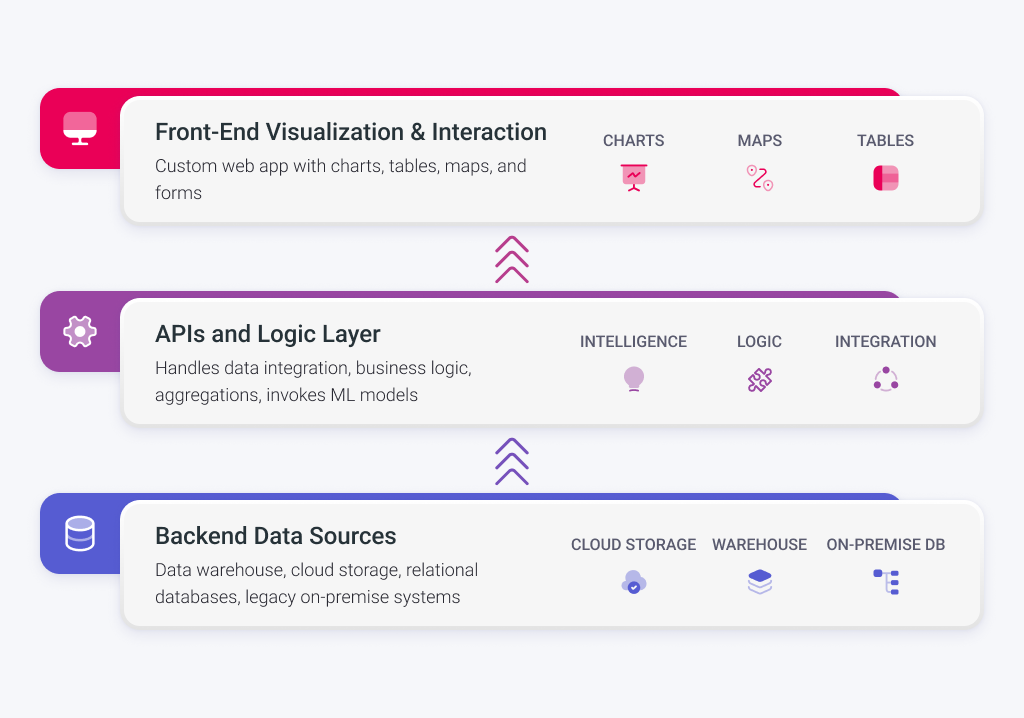
A custom data-driven platform is a purpose-built web application that sits on top of your data infrastructure and AI/ML pipeline, acting as the user-facing “layer” for decision-makers. Unlike off-the-shelf tools, these platforms are tailored to a company’s specific data sources and business workflows. Developing such a platform requires BI software development expertise. Custom data-driven platforms typically consist of:
- Backend Data Sources. At the core are your data stores. This can be a modern data warehouse like Snowflake or BigQuery, cloud storage (Azure Blobs, AWS S3), relational databases (PostgreSQL, SQL Server), or even legacy on-premise systems. The platform connects directly to whatever databases you have, possibly via secure VPN or network links;
- APIs and Logic Layer. Between the data and the UI is a backend service layer that pulls together and processes data on demand. This layer handles data integration, business logic, aggregations, and even invokes machine learning models. For example, an API might fetch the latest sales data, run an ML forecasting model, and return the results. This ensures the UI always has live, consistent data without building it manually in Excel;
- Front-End Visualization & Interaction. The front end is a custom web app that presents the data in intuitive charts, tables, maps, and forms. Because it’s built from scratch, every screen and filter can be designed around how your business users think and work.
Purpose-built data applications are designed around workflows. Instead of separate enterprise data silos (a dashboard here, an Excel sheet there), users get a single environment.
The Missing Layer: Frontend for Data, AI, and ML Systems
While many companies invest heavily in data engineering and ML, we often find the final step is missing: a user-friendly interface. Raw ML models and reports are of little use if end users can’t easily consume them. Our role is to translate complex data and AI output into simple experiences.
We think of what a business user actually wants and deliver it. For example, a demand-planning manager wants to see a forecast curve and adjust variables (like expected demand growth) with sliders, not dive into a Python notebook. They might want to approve or modify an automatically generated order plan with one click.
Custom platforms we build have exactly these kinds of interfaces. We turn raw data into charts and interactive dashboards on one side, and turn ML predictions into task lists or alerts on the other. The “missing layer” here is the humans’ view.
Key Features of Modern Data-Driven Platforms
Custom data platforms can include a wide range of features, but the most effective ones share certain modern capabilities:
Interactive Dashboards
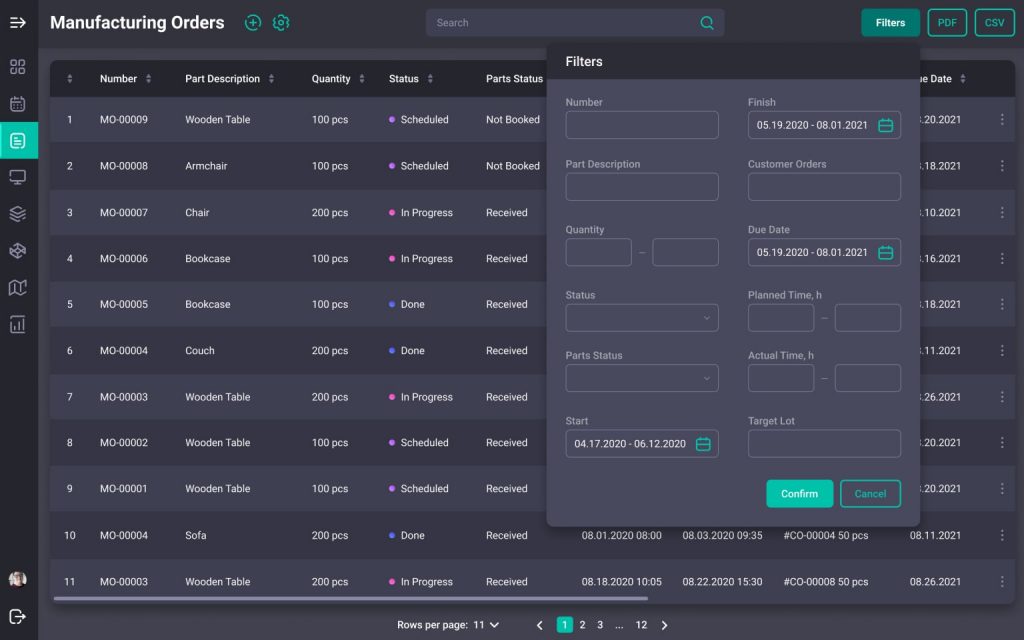
Users should be able to change filters, date ranges, or parameters on the fly. For example, selecting a sales region might instantly update all charts to that region’s data. The dashboards update in near-real-time as new data arrives. Unlike static BI views, these dashboards encourage exploration. Users can drill down, zoom into charts, or switch metrics with a click. It helps uncover insights, as rigid, unchangeable dashboards often miss emerging trends.
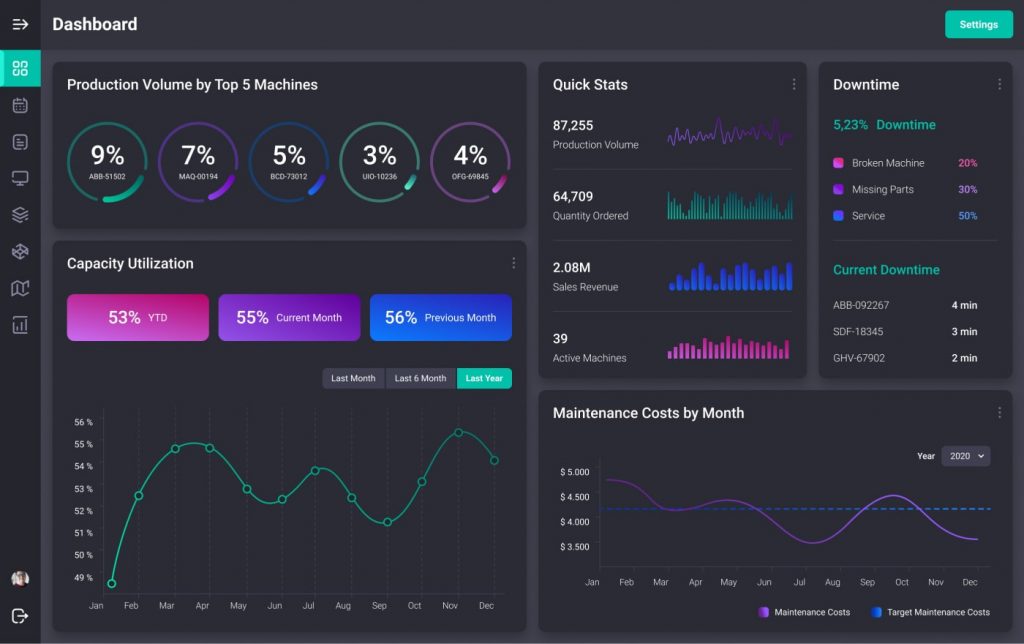
Case study: Advanced ERP Software for Manufacturing Company
Large-Data Visualization
Custom platforms are built to handle big datasets gracefully. Behind the scenes, it may use pagination or lazy loading, so tables only fetch the needed rows. Charts might show summary aggregates that update as you zoom in. In practice, this means even millions of records can be visualized quickly. Techniques like server-side queries and progressive loading ensure the UI stays snappy at any scale.
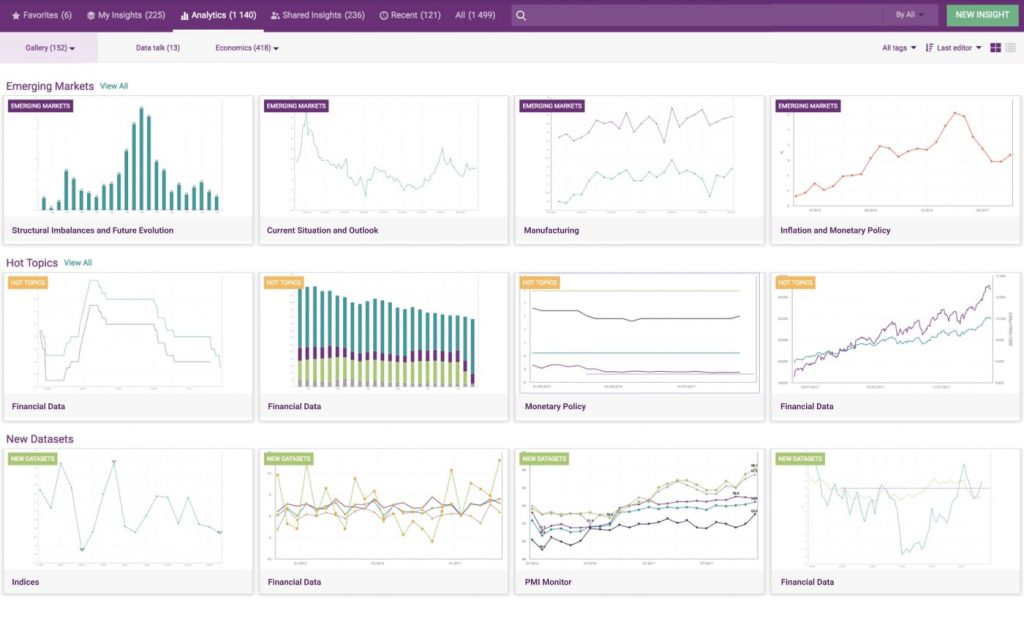
Case study: A Comprehensive Economic Research Tool with Data Visualization Features
Advanced Filtering and Drill-Down
Business users need to slice data by various attributes (time, geography, product line, etc.) and see details. Custom solutions offer powerful search and filter controls, often dynamic drop-downs or smart search boxes, that update the views. If you see an anomaly in a chart, you can click to drill deeper. For instance, in a custom-built investment-research tool (use case above) we developed, users can filter dozens of indicators with multi-select lists, instantly redrawing maps and time series.
Role-Based Access & Security
Unlike public analytics, enterprise data requires strict access control. Custom platforms implement user roles and permissions. For example, sales managers may see their regions’ data, while executives see all. Sensitive fields (e.g. customer IDs) can be masked. Auditing, single-sign-on, and encrypted connections ensure the platform meets compliance needs. In practice, this means each user only sees data they’re allowed to see, with all actions logged.
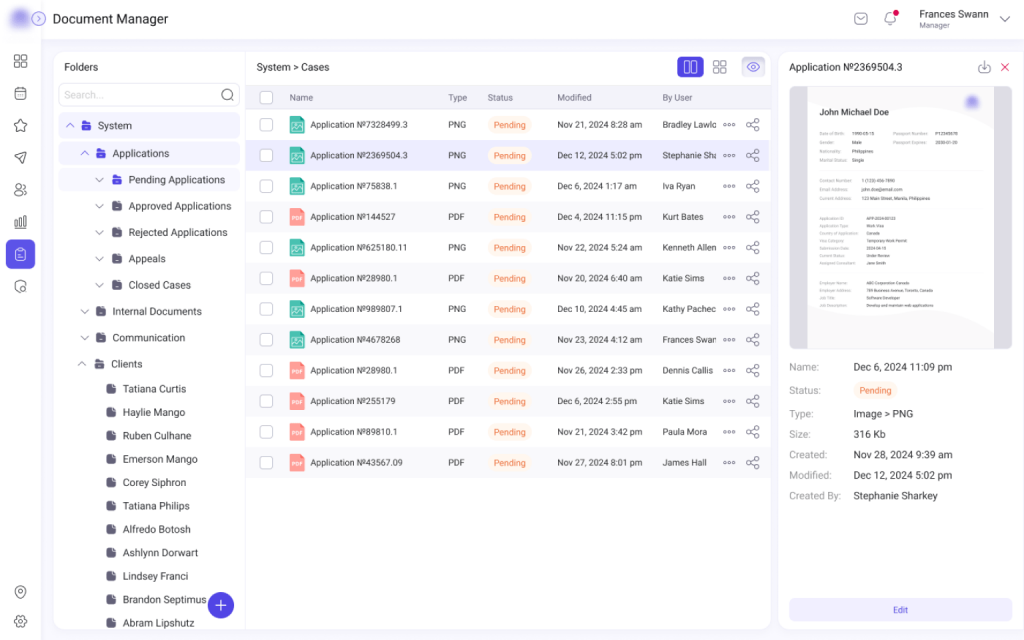
Case study: CRM for Immigration Consultants
Scenario Planning and Forecasting Views
Many industries require “what-if” analysis. Custom platforms often include scenario planners. For example, toggling product price or marketing spend and instantly updating profit forecasts. An interactive forecasting dashboard might let a manager adjust sliders for external factors and see new demand curves. Because the front end is bespoke, these scenario tools can be built into the UI and tied to the underlying ML models.
Real-Time or Near-Real-Time Updates
For truly data-driven operations, dashboards update as soon as source data changes. For instance, inventory levels might refresh every minute. Under the hood, this uses streaming or frequent polling of data sources. The user sees up-to-date KPIs without manually refreshing. Real-time visibility is especially important in applications like demand forecasting, where conditions change hourly.
Demand Forecasting & Planning Applications: Industry Use Cases for Custom Data Platforms
To make this concrete, consider a typical application planning and demand forecasting software. This is essential in industries like manufacturing, retail, logistics, and energy, and illustrates the value of a custom platform.
Case study: Advanced ERP Software for Manufacturing Company
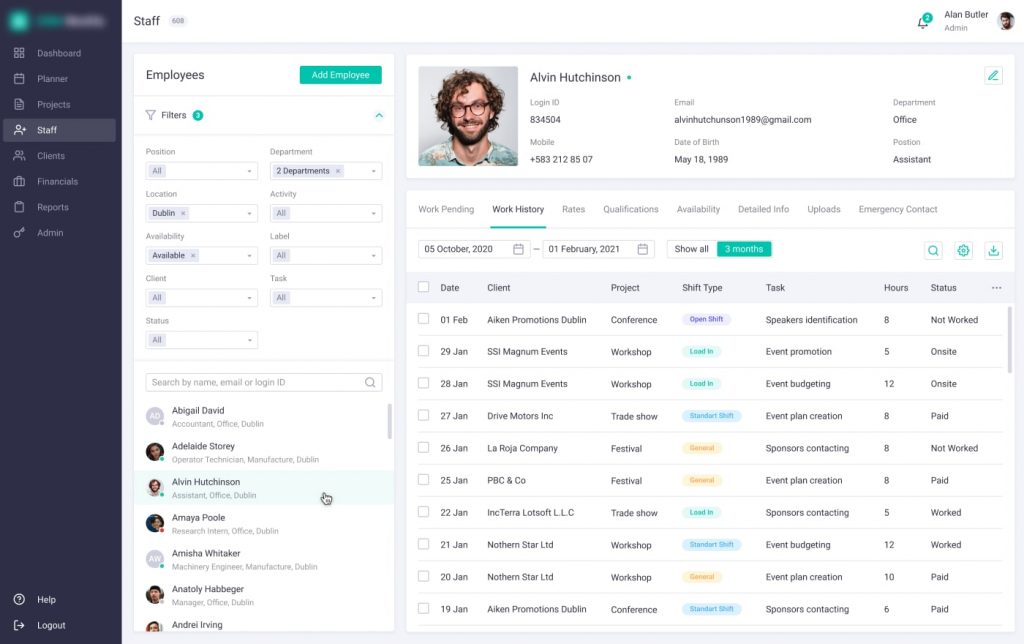
Case study: Automated Workforce Management and Scheduling System
When a Business Needs a Custom Data-Driven Platform
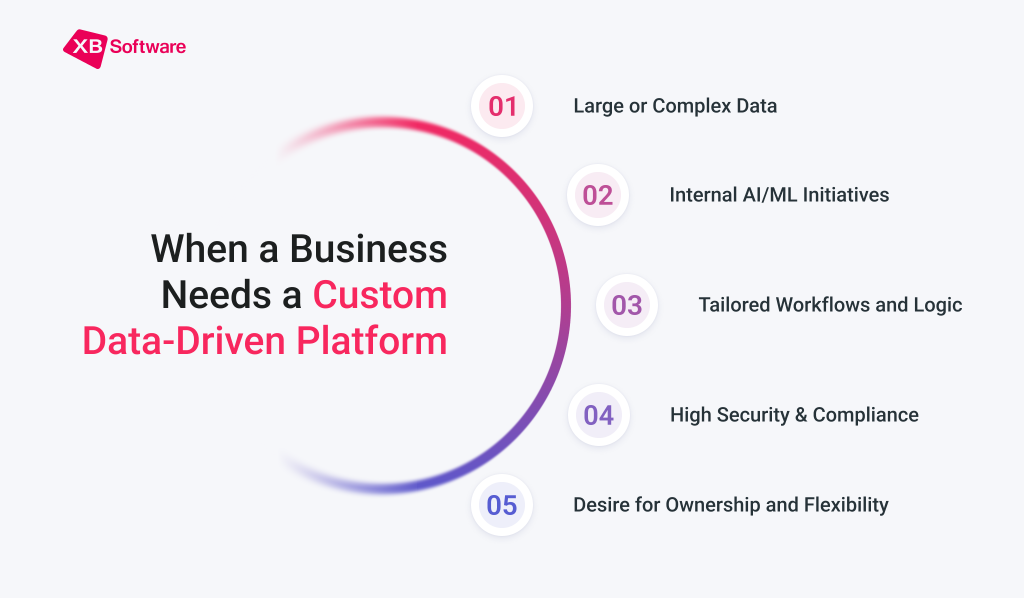
Building a custom platform is ideal when a company’s needs go beyond what standard tools offer:
- Large or Complex Data. Organizations with huge or rapidly growing datasets benefit, because a tailor-made solution can optimize performance for their specific workload;
- Internal AI/ML Initiatives. If your analytics or data science teams are generating machine learning models, a custom platform is the way to operationalize them. This is key to AI decision support systems: the AI drives the logic, but the custom interface delivers it in context;
- Tailored Workflows and Logic. Companies with unique business processes often need special features (complex approval flows, custom KPIs, special data hierarchies, etc.). A custom platform can encode all that logic, delivering alerts, data entry forms, multi-stage approvals built directly into the UI;
- High Security & Compliance. When data is sensitive or regulated, like in healthcare, companies often require full control. Custom platforms allow implementing enterprise-grade security (certified encryption, audit logs, multi-factor auth) to satisfy auditors. They can also ensure data residency rules are met (keeping data physically in a country;
- Desire for Ownership and Flexibility. Some enterprises prefer to avoid long-term licensing or vendor lock-in. A custom solution means you own the code and UI. You can modify or extend it in the future without being constrained by a vendor roadmap. It’s also easier to integrate with existing enterprise software (ERP, CRM, custom LIMS, etc.).
Conclusions: From Data Overload to Confident Decisions
In the era of big data and AI, data collection alone doesn’t drive value. What matters is how effectively organizations turn that data into insight. Custom data-driven platforms close the loop: they take the raw outputs of databases and ML models, and present them through intuitive, interactive interfaces that users can actually use in their workflows. With a well-designed platform, data becomes democratized: executives see live KPIs, planners test scenarios, and front-line teams can act on alerts within the same system. To discuss how a purpose-built platform can transform your data into confident decisions, feel free to contact us.