Summary
This article walks you through developing a Microsoft Excel add-in using React, enabling your team to extend Excel’s functionality seamlessly with modern web technologies. It covers everything from setting up the development environment (Yeoman generator, Office.js APIs) to creating UI components, customizing ribbons, and deploying across Windows, macOS, and the web. You’ll learn how to build enterprise-grade add-ins — for automation, analytics, or custom workflows — without relying on VBA or legacy codebases.
Tech industry giants spend enormous resources on top-notch solutions development to cover the needs of an average person from a vast user base. However, you’re not an average person, and your business’s requirements may lay far beyond what an average company in the market needs. Thus, the question may arise about how to expand the functionality of familiar office applications, for example. Rebuilding such complex systems as Microsoft Excel from scratch to access additional functionality is quite an extensive task in terms of time and resources.
Luckily, you can relatively easily add extra features to Microsoft Excel, be it a button for quickly calculating a specific formula or a function for deleting duplicate records in large data sets. Today, we’ll consider how you can develop your own Excel add-ins with React to add custom functionality to this famous spreadsheet editor.
What’s Excel Add-in Anyway?
Long story short, Excel add-ins are pieces of software that you can add to Microsoft Excel to make it more functional. They represent what Excel macros and plugin development infrastructure evolve into. There are plenty of features in this spreadsheet editor. Still, there’s always room for improvement and automation, and such solutions are excellent for tailoring this software solution for specific tasks and workflows.
For example, if performing the same task manually over and over again feels overwhelming, you can delegate it to an add-in that will do everything automatically. Does your Excel need more advanced data analytics or custom reporting? Not a problem. Just spend some time on add-in development, activate it, and you’re ready to go!
Excel add-ins are easily accessible as they can take the form of custom ribbons, panes, or functions inside the Excel user interface. Also, they work with different platforms, such as Windows or macOS, and support the web version of Excel.
The development of Excel itself highly relies on the use of C++ and Objective-C programming languages. Luckily, there’s no need to learn C++ and struggle with the steep learning curve it’s famous for. VBA, also known as Visual Basic for Applications, is also not required. As it turned out, Microsoft’s invention for creating macros to automate word- and data-processing functions can’t really run on browser versions of Office 365. Instead of porting VBA, Microsoft decided to enable web technologies for add-in development. Thus, you can rely on such tech as HTML, CSS, JavaScript, and TypeScript. Also, frameworks like Angular, React, or jQuery can be used. Add-ins themselves work as a combination of a web application and a manifest file. The Office JavaScript API library developed by Microsoft enables such web apps to interact with Excel, Outlook, Word, and other Office applications.
For testing purposes, you can install add-ins manually on your computer. In a network of computers, there must be at least one machine with a manifest stored in a public folder. All users with access to this folder can configure the path to this folder in Excel to make the add-in work.
Spreadsheets are widely used in marketing, finances, and consulting. What unites them all is the high probability of disastrous consequences in case of data leaks. Therefore, security is one of the main concerns regarding Excel add-ins. Here, you’ve nothing to worry about. These pieces of software you add to Excel work in a sandboxed environment. It means that they have limited access to the data stored on the computer and are pretty safe to use if you want to keep your clients’ secrets. However, if your work implies sending sensitive data back and forth over the Internet, ensure your Excel add-in is built by a reliable software development company.
Excel add-ins are easy to handle from the development and customization standpoint. You can implement and add new functionality as your business enters new frontiers and requires new possibilities. New custom formulas, new data visualization tools, exporting and importing data to and from new sources, stock analysis in new markets, and many other possibilities are open for you.
To see how fruitful the results of combining web development technologies and Microsoft Office solutions can be, you can check the Excel add-in with access to real-time data that we built the other day:
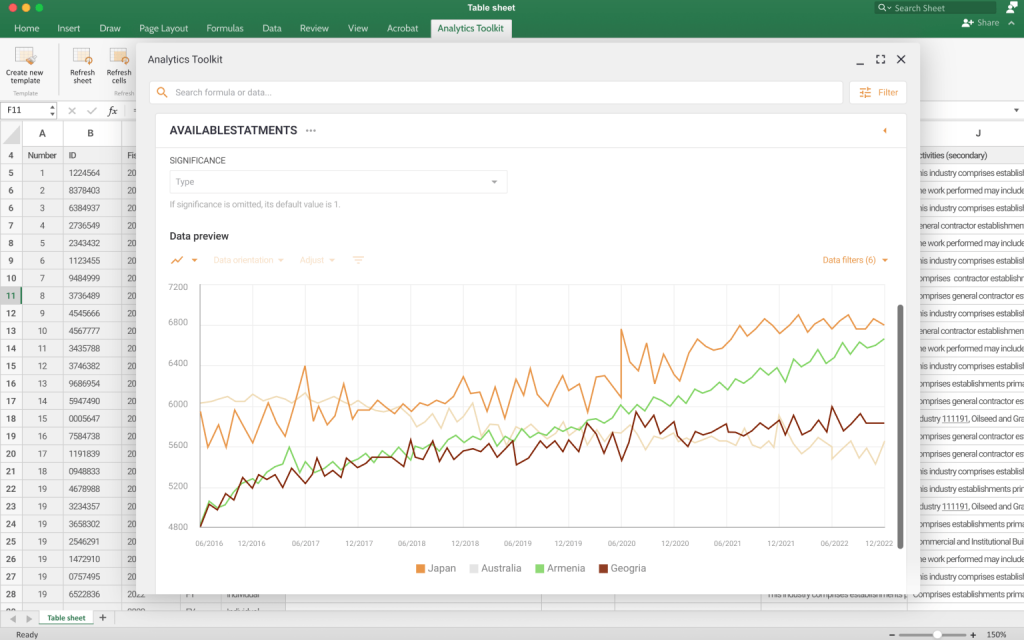
It can integrate with enterprise apps to access real-time and historical data. Most probably, your office application provides access to corporate data after authorization (login/password or MFA). In this case, the add-in can implement a data access process similar to the one that your main office application has.The solution allows advanced data searching and filtering capabilities. The automated data-filling feature enables easy and quick reporting. Also, the customizable report distribution function provides all stakeholders access to data from reports.
Let’s Build Something!
Prerequisites
Before we can start the Excel add-in development process, we must ensure that all dependencies are installed. First, we’ll need Node.js, so make sure you’ve downloaded and installed it. Obviously, you must have Excel installed on your machine or have access to the online version of it to test the add-in.
We’ll use Yeoman and Yeoman generators for Office to create the new Excel add-in development project. After you’ve got Node.js up and running, you can install them globally using the node package management with this command:
|
1 |
npm install -g yo generator-office |
Creating a New Project
Now, after all the preparations are complete, we can generate a new project:
|
1 |
yo office |
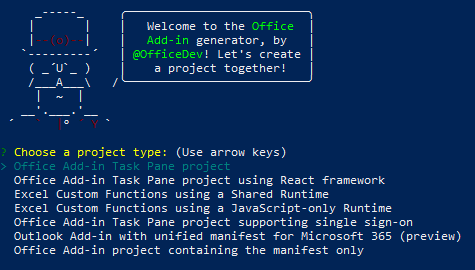
You’ll be asked a series of questions determining how the development environment will look like. All you have to do is choose the Office add-in project using React as a project type, choose JavaScript as the primary programming language, set the name for your project, and select Excel as the Office application you’ll create the add-in for:
After running the yo office command, you’ll have to wait until it finishes creating the new development project. To test if everything went well, enter the project’s root directory. Its name corresponds to the chosen project name, so the command will look like this:
|
1 |
cd my_excel_addin |
If you’re using a Mac, you should start the dev-server as shown below:
|
1 |
npm run dev-server |
And finally, we can check if everything functions properly:
|
1 |
npm start |
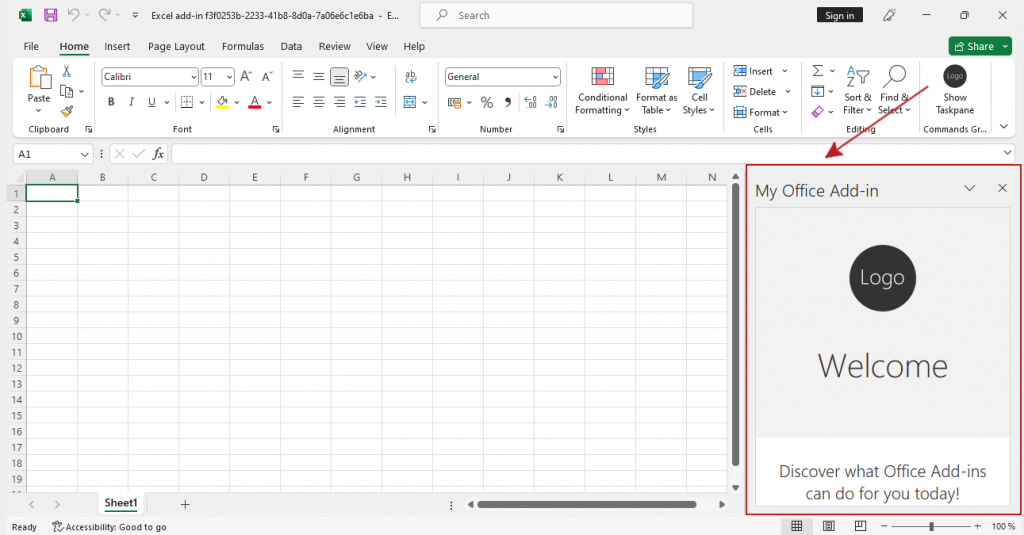
This command will start Excel and load the add-in into it. As you can see in the screenshot below, it’s accessible via the ribbon from the Home menu:
Before we move any further, let’s quickly discuss some files involved in the development process.
Discovering the Project Structure
The directory structure of a freshly created development project looks like this:
|
1 2 3 4 5 6 7 8 9 10 11 12 13 14 15 16 17 18 19 20 21 22 23 24 25 |
My Office Addin/ ├── manifest.xml ├── package.json ├── src/ │ ├── taskpane/ │ │ ├── taskpane.html │ │ ├── taskpane.css │ │ ├── index.js │ │ ├── components/ │ │ ├── App.js │ │ ├── ... │ ├── ... ├── ... |
The manifest.xml contains the project dependencies and configuration. This file lets Microsoft Office know where specific files, for example taskpane, are located. Also it tells Microsoft what buttons to add to the ribbon and the name of the function to call when clicked. The file is rather important, and luckily for us, it has already been generated, and there’s no need to edit any data for our tiny development experiment.
The src/taskpane/taskpane.html file in this project serves as the user interface (UI) for the Excel add-in task pane. It is an HTML file that defines the content and layout of what appears within Excel when the add-in is opened. It doesn’t have much code by default, but there’s a pretty important piece we’d like to mention:
|
1 2 3 |
<body class="ms-font-m ms-Fabric"> <div id="container"></div> </body> |
As we’ll see further, this tiny div container plays a vital role in our development project. The src/taskpane/index.js file orchestrates everything so to speak. Look at this code:
|
1 2 3 4 5 |
/* Render application after Office initializes */ Office.onReady(() => { isOfficeInitialized = true; render(App); }); |
It tells us that the component will be rendered right after the Office application initialization. Where will it be rendered, you may ask. Here’s the answer we can find in the same file:
|
1 2 3 4 5 6 7 8 |
const render = (Component) => { ReactDOM.render( <AppContainer> <Component title={title} isOfficeInitialized={isOfficeInitialized} /> </AppContainer>, document.getElementById("container") ); }; |
This data tells us that the React web application we’re going to build will be rendered within the <div id=”container”></div> container we discovered earlier.
Finally, src/taskpane/components/App.js is where the React web application working as the Excel add-in lays. And that’s exactly where we’re heading in order to look at an example of how the development of such a component with React works.
Building a React Component
As all roads lead to App.js, let’s open this file and build our React component. The question is, what will our add-in do? Let’s focus on the development of data analysis tools. We’ll teach the app to calculate the average from selected cells in one click. We’ll add a quick chart-building feature to make our programming lesson even more exciting.
Read Also Taking the Best of React and Webix with Micro Frontends
Here’s the code for building our React component:
|
1 2 3 4 5 6 7 8 9 10 11 12 13 14 15 16 17 18 19 20 21 22 23 24 25 26 27 28 29 30 31 32 33 34 35 36 |
import * as React from "react"; export default class App extends React.Component { constructor(props, context) { super(); this.state = { condition: '', }; } handleCalculateAverage = async () => { //calculating the average value }; handleCreateChart = async () => { //building a chart }; render() { const { title, isOfficeInitialized } = this.props; if (!isOfficeInitialized) { return ( <h1>Something went terribly wrong.</h1> ); } return ( <div> <h1>Data Analysis</h1> <button onClick={this.handleCalculateAverage}>Calculate Average</button> <button onClick={this.handleCreateChart}>Create Chart</button> </div> ); } } |
Let’s consider what’s going on here:
- The App class is defined as a React component. It extends React.Component and works as the main entry point for the task pane’s UI;
- The constructor method initializes the component’s state. In this case, it sets the initial state with an empty condition;
- handleCalculateAverage and handleCreateChart are methods that will calculate the average value and build the chart using the selected values. We’ll deal with them later;
- The render method defines the UI of the add-in. It checks if the Office is initialized and displays an error message if not. If the initialization is completed successfully, it shows a “Data Analysis” title and two buttons: “Calculate Average” and “Create Chart.” Clicking these buttons triggers the respective functions for performing actions within Excel;
Let’s look at how our Excel add-in for data analysis looks at this development stage. You don’t need to run any additional commands to see the results if you didn’t close the Excel window we launched earlier. Just save the files, and switch to the window:
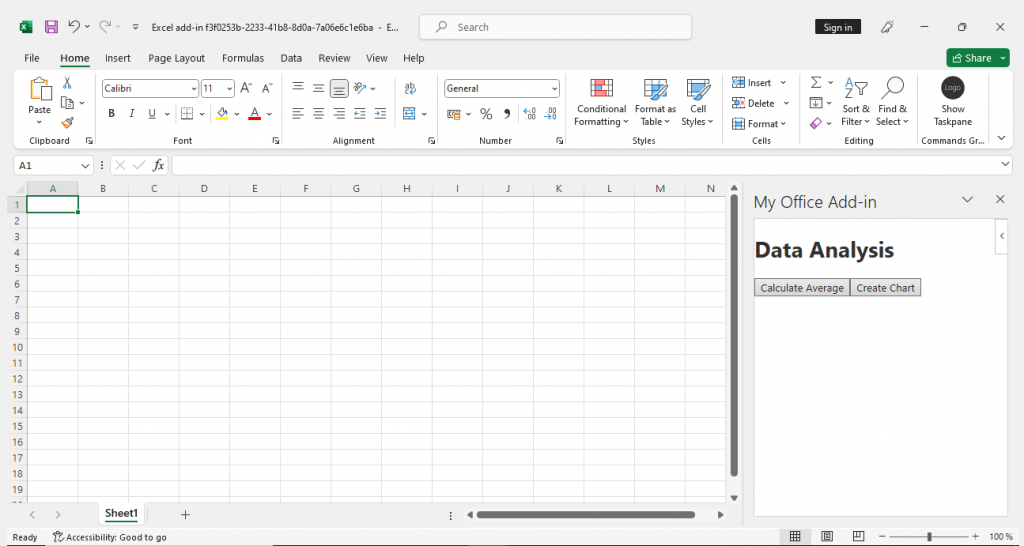
Doesn’t this look promising? Here are the buttons we’ve created in our React component, but it’s too early to consider the task done. We should breathe some life into these buttons before testing them in practice.
Here’s the method for calculating the average value of selected cells and writing the answer into the first free cell in the column:
|
1 2 3 4 5 6 7 8 9 10 11 12 13 14 15 16 17 18 19 20 21 22 23 24 25 26 27 28 29 30 31 32 33 34 35 36 37 38 39 40 41 |
handleCalculateAverage = async () => { await Excel.run(async (context) => { const selection = context.workbook.getSelectedRange(); // Load data that we need for calculation selection.load('values, columnCount, rowCount'); await context.sync(); // Get these values const values = selection.values; const numRows = selection.rowCount; const numCols = selection.columnCount; let total = 0; let count = 0; // Ensure the selected range contains numerical values for (let row = 0; row < numRows; row++) { for (let col = 0; col < numCols; col++) { const cellValue = values[row][col]; if (!isNaN(cellValue)) { total += cellValue; count++; } } } if (count > 0) { const average = total / count; // Get the cell below the selected range const cellBelow = selection.getCell(numRows, 0); // Write the average value with the word "Average" in the cell below cellBelow.values = [['Average ' + average]]; await context.sync(); } }).catch((error) => { console.error(error); }); }; |
This method is an asynchronous function that uses the Excel JavaScript API to interact with Excel. It loads the selected range, iterates through the values to compute the average, and then writes the result with the word “Average” in a cell below the selection.
Now, the next step is to define the method for building a chart from selected values:
|
1 2 3 4 5 6 7 8 9 10 11 12 13 14 15 16 17 |
handleCreateChart = async () => { await Excel.run(async (context) => { const selection = context.workbook.getSelectedRange(); // Create a new chart based on the selected data const chart = context.workbook.worksheets .getActiveWorksheet() .charts.add(Excel.ChartType.columnClustered, selection, Excel.ChartSeriesBy.columns); // Set the chart title chart.title.text = 'Data Chart'; await context.sync(); }).catch((error) => { console.error(error); }); }; |
This code adds a clustered column chart and sets its title.
Testing How Everything Works
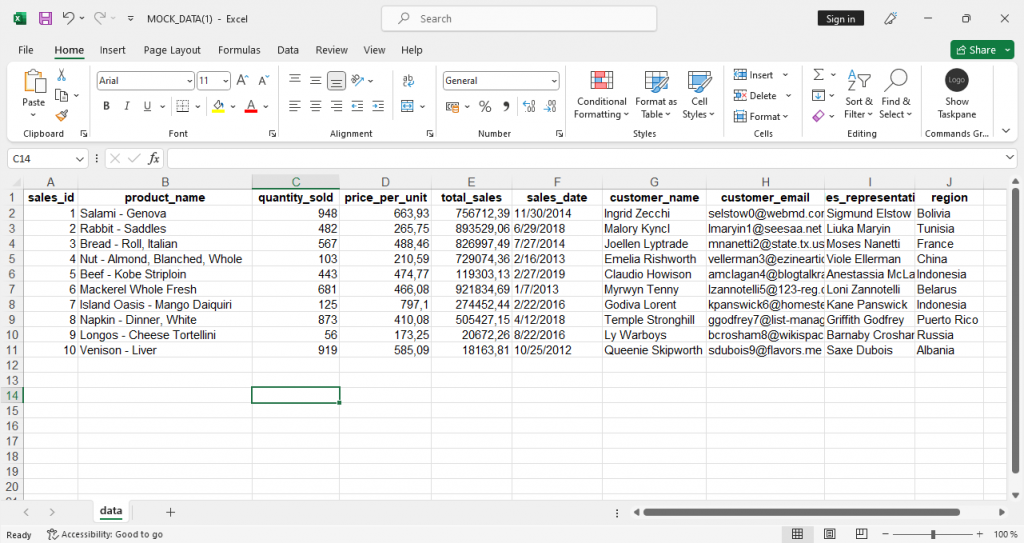
The next question is how to test our exclusive and fully functional Excel add-in for data analysis. For example, we can generate some fake data using the Mockaroo service and open such a file in Excel. Here’s our data set:
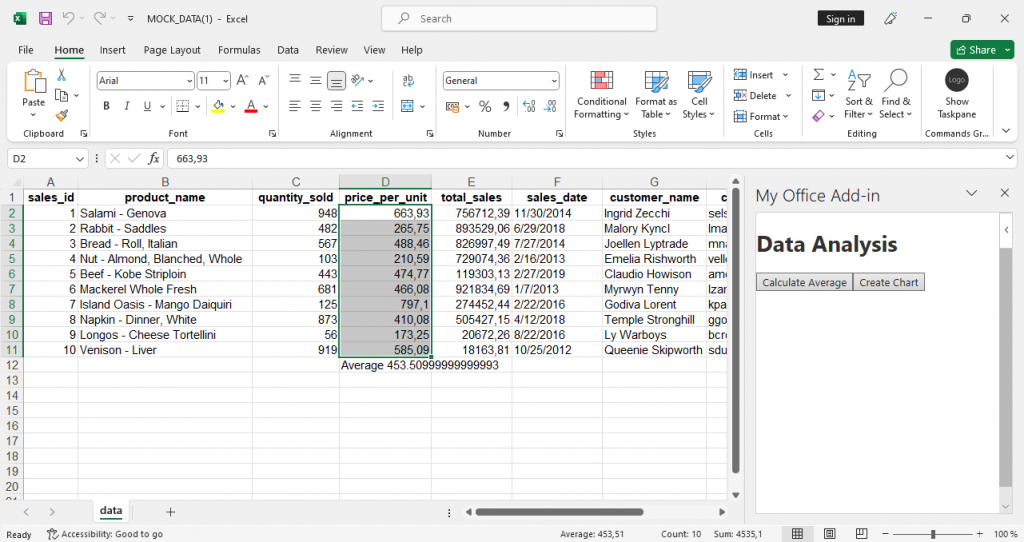
First, to test our component, let’s calculate the average price per unit sold. For this, we can select the price_per_unit column and click the Calculate Average button:
One is working, one more to go! The next stop in our development journey is testing if we can transform data into a visually digestible format. Say we want to determine which products are most often purchased. For this purpose, we can select columns containing product names and quantities sold and click the Create Chart button:
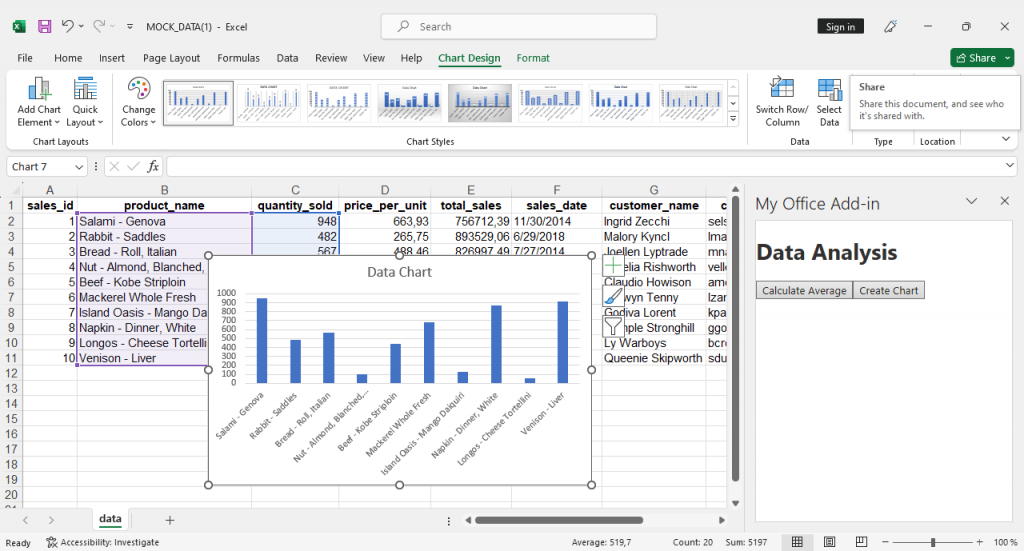 The data shows that there are too many salami lovers out there, and frankly, I can’t blame them.
The Excel add-in we built today doesn’t do much, and it’s hard to call it a breathtaking example of web development since it has only two buttons. However, we can call these two buttons a decent result for such a small amount of coding. It ain’t much, but it’s honest work! They allow you to quickly jot down a rudimentary report or tally up monthly numbers. Some polishing, and you’ll get yourself a convenient tool.
Conclusions
Excel add-in development offers rich possibilities in the field of data processing and analysis. Almost anything that can be programmed with JavaScript or TypeScript and turned into a visual tool with React or Angular can be integrated into Excel. The web development technologies provide a structured and efficient way of designing the user interface for Excel add-ins, making creating interactive and user-friendly experiences easier. Contact us if you want to turn Excel into your own “Swiss army knife,” where every possible data analysis tool is always at hand.