Summary
Every project, company, or process manager always has an inherent desire to improve team workflow and increase productivity. Any, even the most robust project, may be inevitably changed because of unexpected events. In this case, software solutions can make it possible to make the necessary adjustments.
There are a huge number of basic tools for optimization and simplification of assigned tasks. When we organize complex processes with a large amount of data, we try to put it in order to better understand it and have a more convenient working process. Indeed, having a platform that not just gathers the information on your project, but also displays the data in the form of tables, diagrams, and charts is really useful. That is why in most of our solutions, we use Webix JavaScript library that has many ready-made tools for data visualization, whether simple or complex.
Gantt chart is a good option for improving planning, and we have the widget for that. So, let’s see how Webix Gantt Chart can be customized to boost your planning and project management experience.
When to Use Webix Gantt Chart
The most striking examples where the maximum use of the Gantt chart functionality is involved can be found in the implementation of the following activities:
Planning and Conducting a Marketing Campaign
Marketing campaigns require large-scale simultaneous collaboration and coordination – as a result, you can easily lose sight of individual moving elements or the bottlenecks. Gantt makes it possible to optimize this process by designating the sequence of tasks, their performers and deadlines. At the same time, different structural divisions of the company will know not only who is responsible for what, but also how their work affects other divisions or a common goal.
Presentation of Results to the Client
If you work in a company that needs to give results as output of its activities, Gantt can be used to present to customers a chronology of expected results and the estimated time spent on achieving them. Having outlined the plans using Gantt, you will have the opportunity to provide the client and other interested parties with a clear understanding of your goals and deadlines for achieving them, and they will know not only the deadline for the completion of part of the project, but also when exactly you will work on it.
Product Launch Planning
In the case of product development and product launches (tangible and intangible), you can use Gantt to outline the entire plan from initial ideas to launch and further work or support. By visualizing everything on Gantt, you will have the opportunity to easily identify conflicts before starting work, anticipate dependencies between stages and get a clear understanding of all events leading to the launch and the time of their occurrence/phased transition.
For a more consistent understanding of the functioning of Gantt and customization for the needs of a potential client, we suggest considering case planning and conducting a marketing campaign. We are revealing the capabilities of the Webix Gantt chart component and how and in what cases it should be used, as well as show the implementation of some features that we worked on with the team on one of the projects. You can find a demo with the implementation of the features described below at the end of the article.
Read Also Clash of the Libraries. Building a Data Dashboard with React, Vue.js, and Webix
Customizing Webix Gantt Chart Up to Your Needs
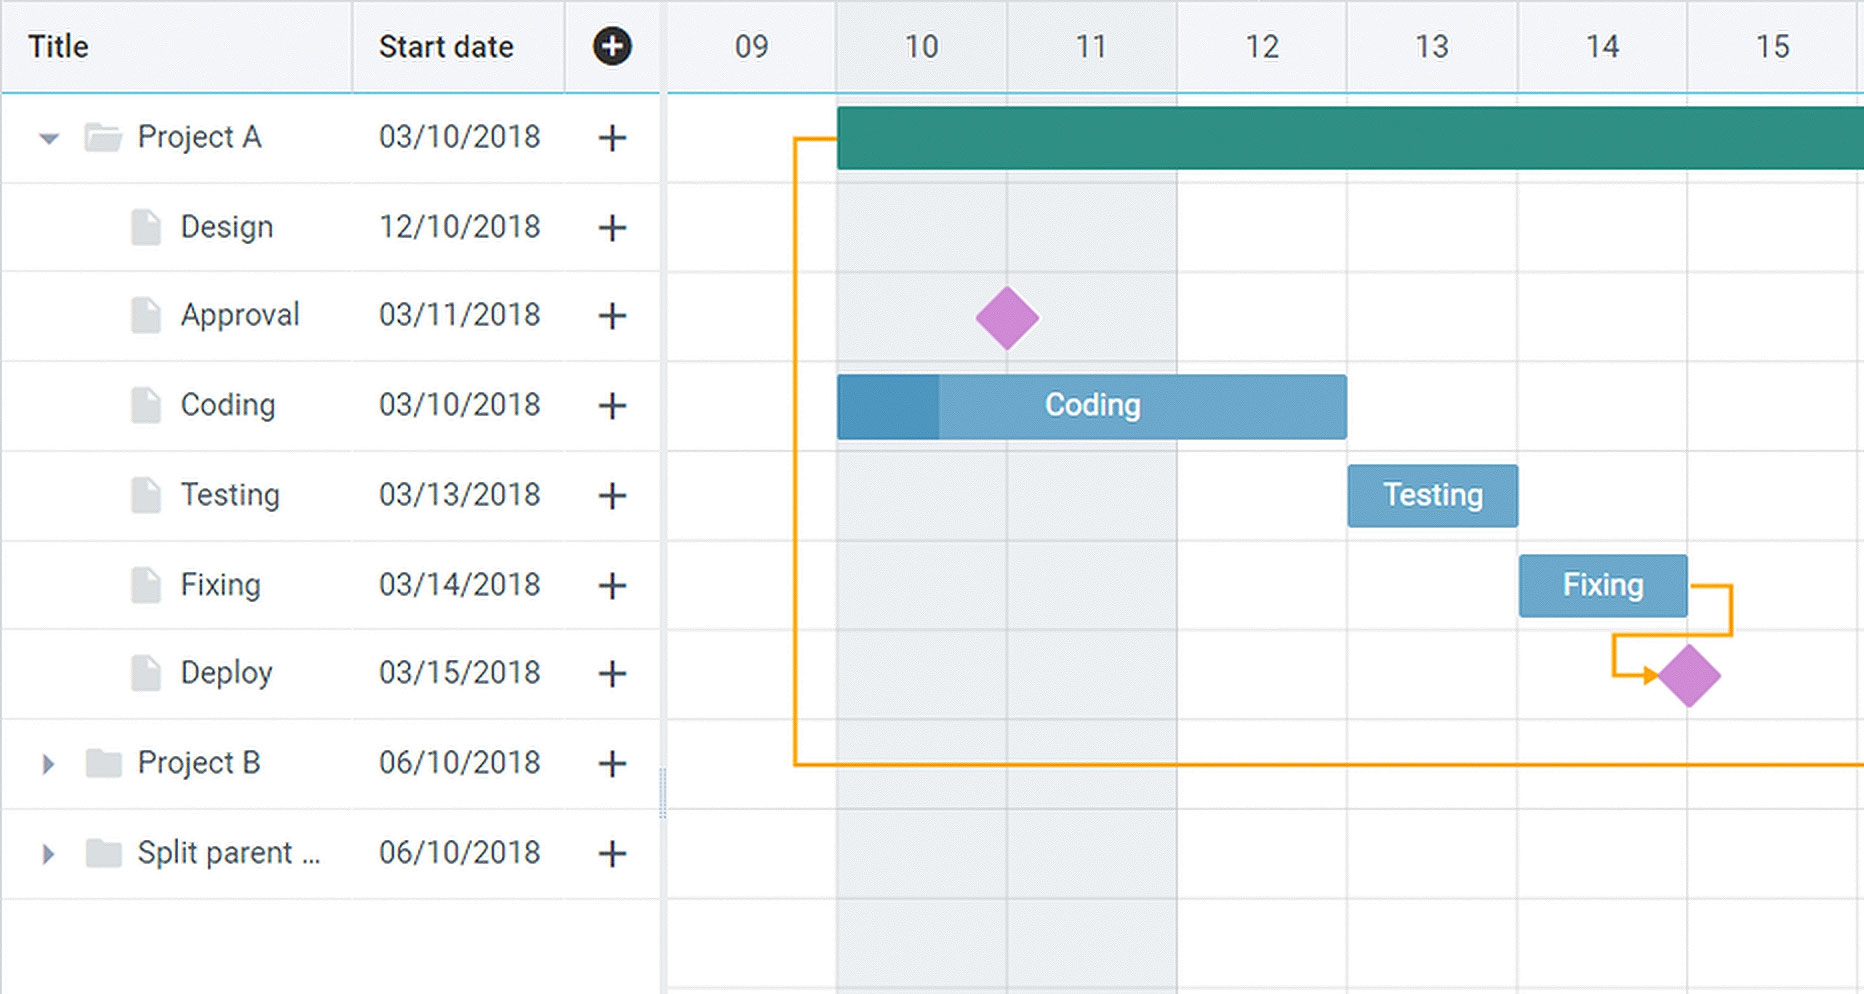
As we know, the Gantt chart is used to display projects and tasks visually for easier planning. Below we see a project that is divided into several stages, each of which is located on the timeline and has its own duration. Sometimes it is convenient to arrange not only projects and tasks in this form, but also other processes that have a time period.
There is a shopping center with screens placed for advertising. Different companies can buy time for their ads on one or more screens. At the same time, simultaneous placement of several advertisements on the same screen is unacceptable. In this scenario, we have processes – advertising of specific companies – which would be very convenient to place on the timeline. And on the left of the list, we place specific screens. But there is a nuance here. In the case of the standard use of a Gantt for project planning, we have a list of stages on the left, and a stage corresponding to each line on the right. In a case with advertising, we can do the same principle:
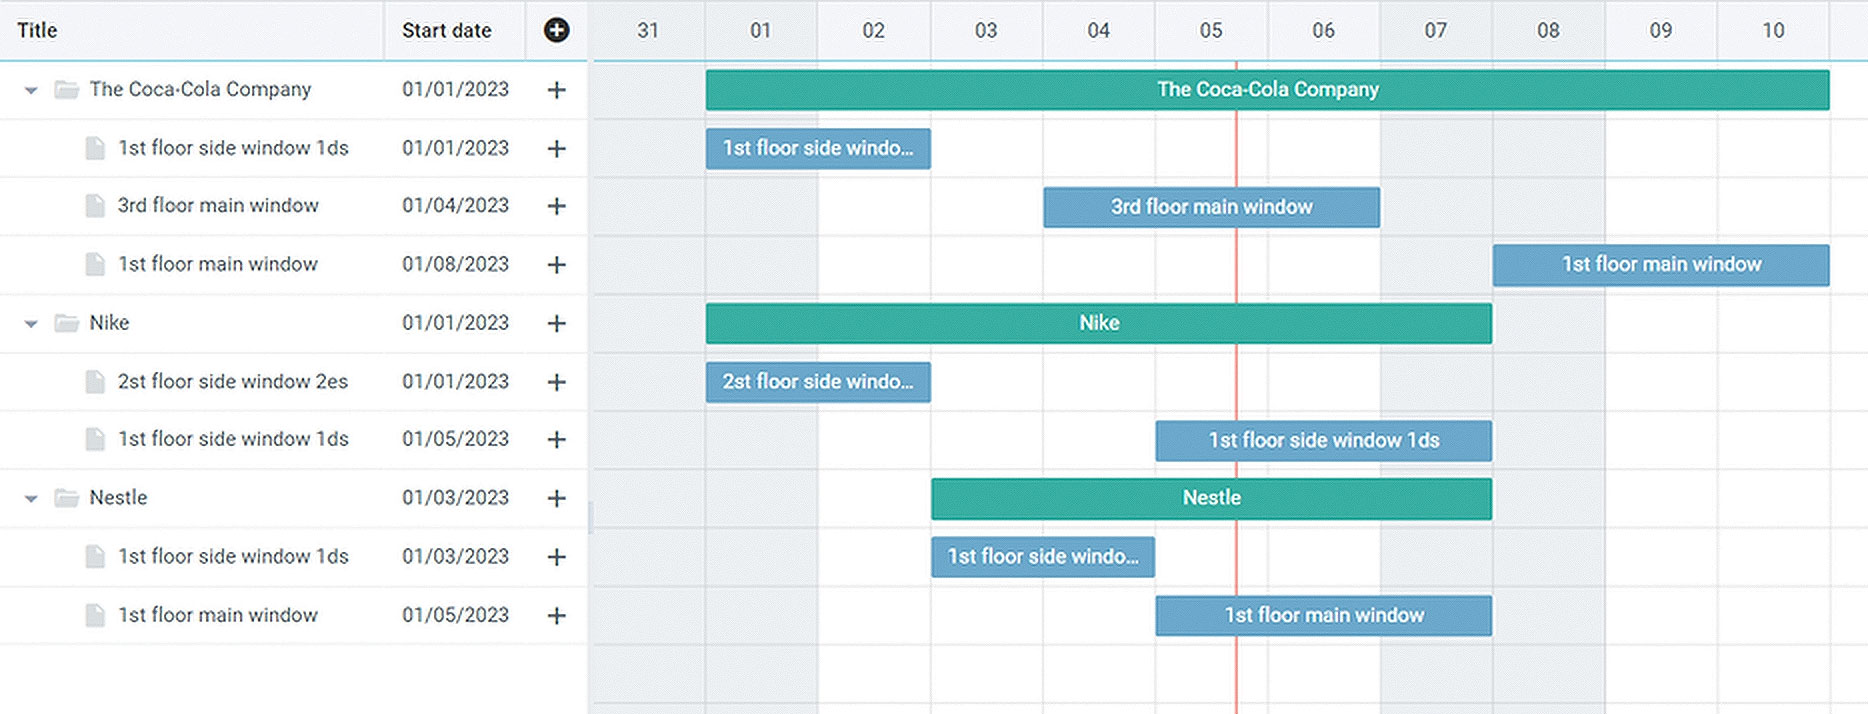
The Gantt chart will help structure the project by breaking it into stages for smoother and clearer business management. We have a list of companies that have bought ads, and points where they need to place them. With this display, if we want to change ad display dates, it can be difficult to see where ad space is already taken by another company, especially if there are many such companies. Let’s try another option. List of screens and within the company that occupied this screen with ads:
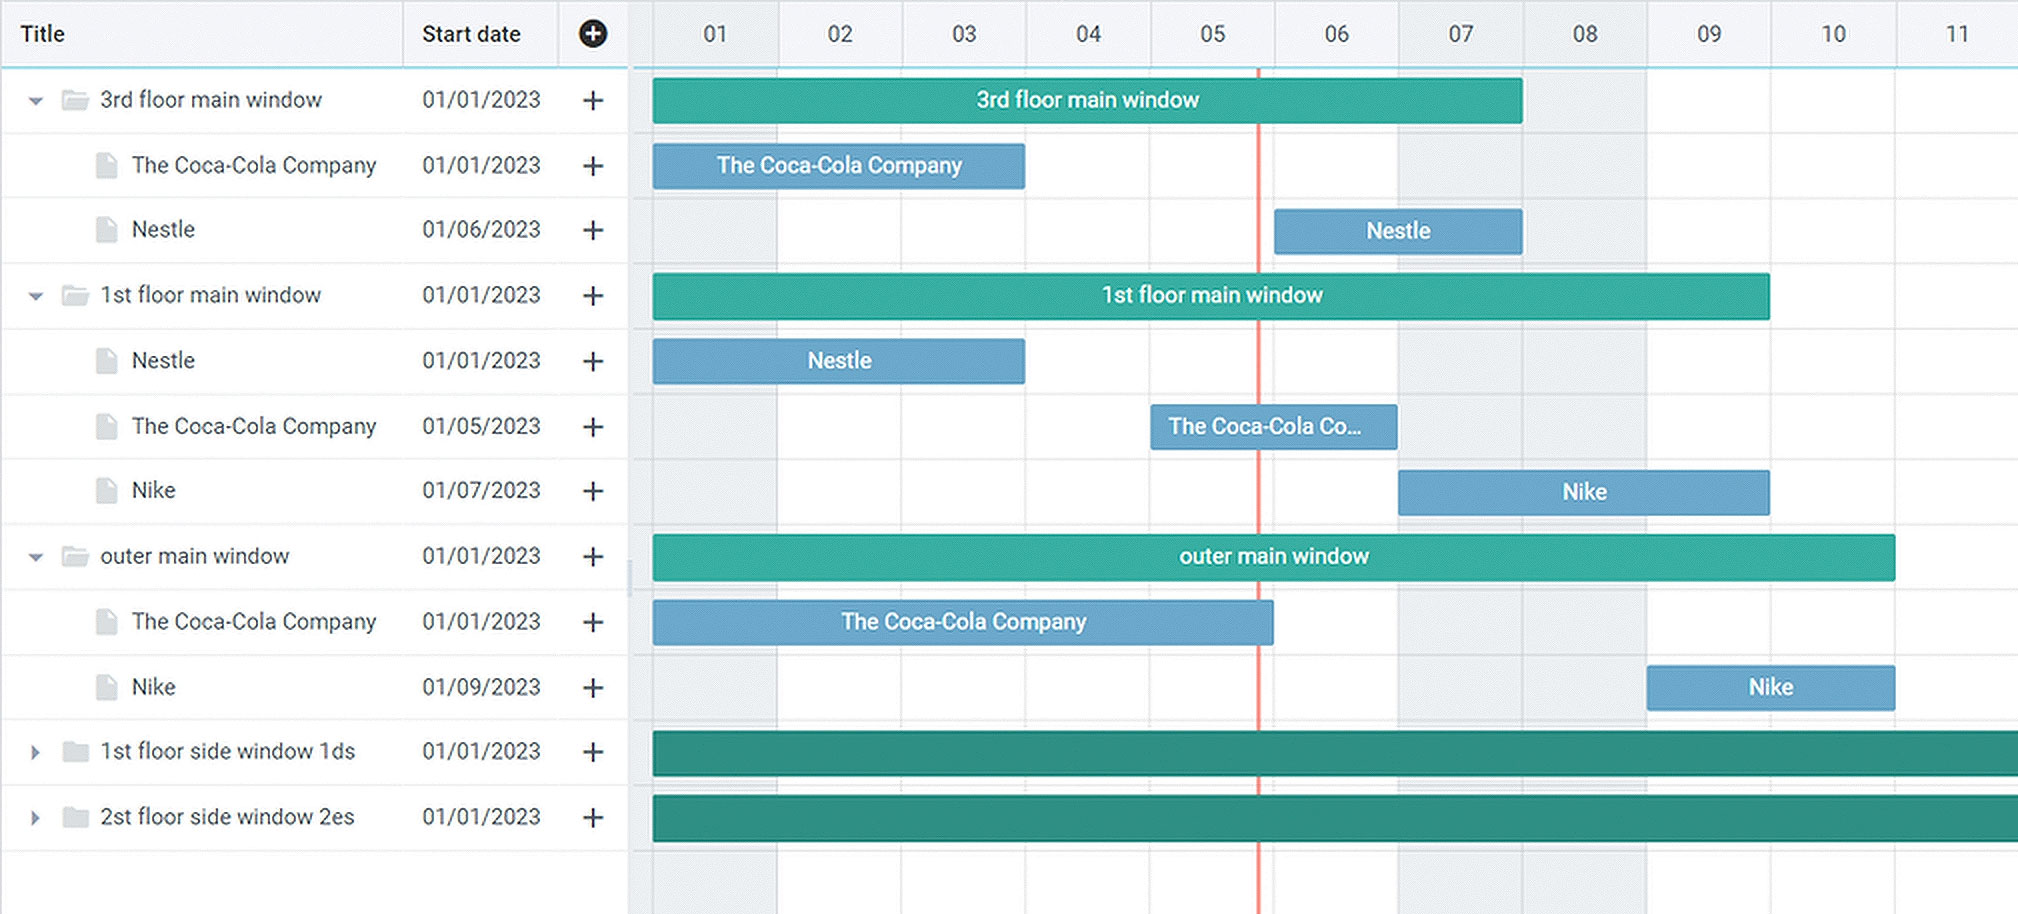
So much better. But if there are too many companies, then there will be a lot of empty space that is not needed, and the diagram will no longer be as convenient and beautiful. In this case, it would be nice to arrange several companies in one row. To implement this idea, the standard features of Webix Gantt are not enough. But fortunately, this widget lends itself perfectly to customization. For example, here’s how we took the widget and customized its functionality for a salon management software for one of our clients:
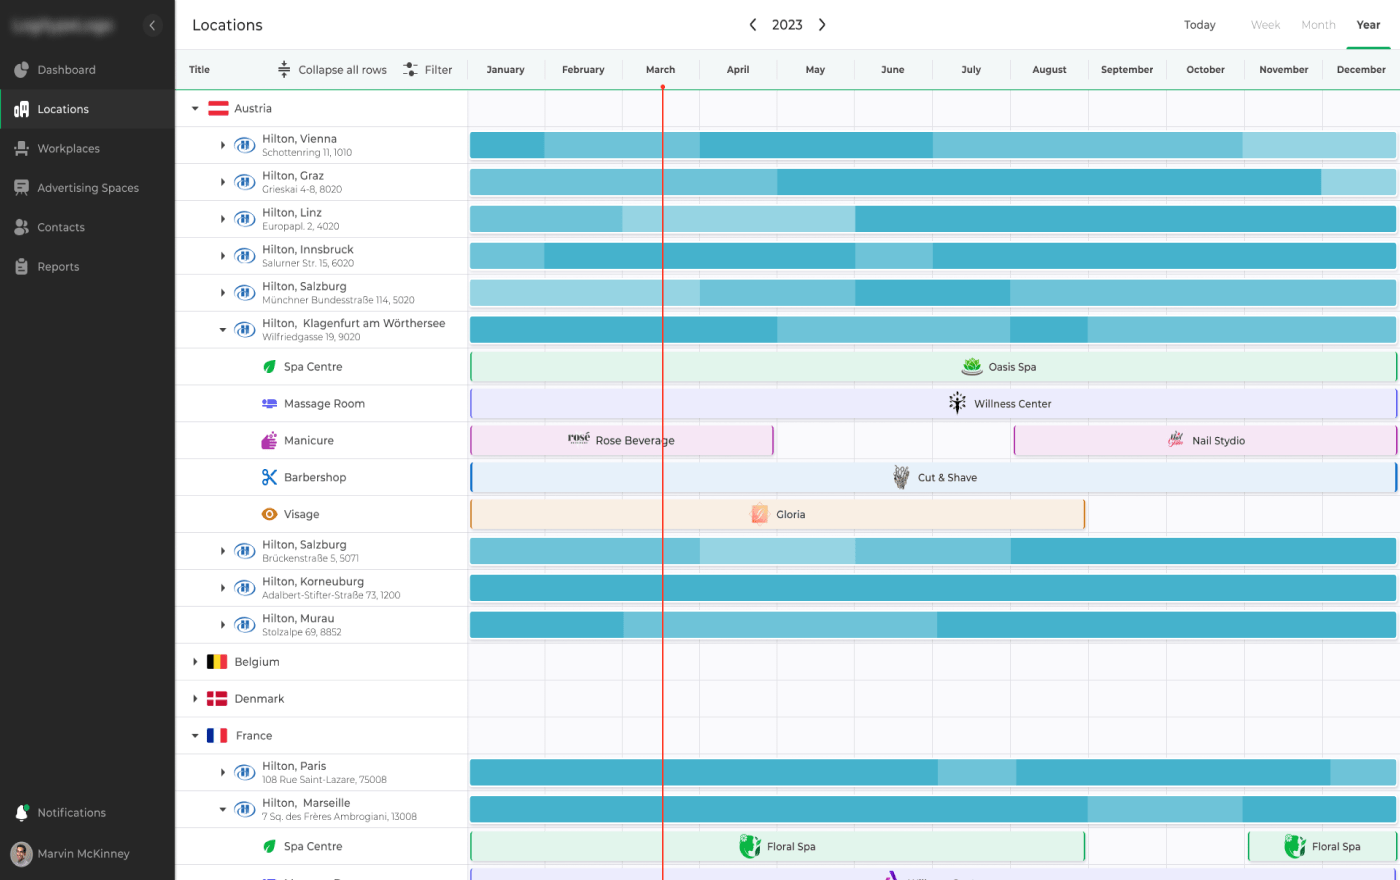
Source: Complex Gantt Widget for Salon Management Software
Although the Gantt chart can be quite complex, the basic principles of its operation are easy to master. Using our guide, you will form a clear idea of what Gantt charts are and when to use them, as well as get tips on creating them and more.
In most cases, Gantt charts also provide additional information about how the tasks in the project are related to each other, to whom they are assigned, as well as what important deadlines and milestones are ahead. Using a dynamic Gantt chart, employees can quickly get an idea of what they are responsible for and how their work affects the project as a whole.
The widget contains several modules that we can redefine individually. Let’s go through the main ones.
Bars. Responsible for the visual representation of the stripes in the scale area. Here we can arrange the strips at our discretion, change their style (color, indents, etc.), hang tooltips and much more.
Tree. Respectively responsible for the left list. We can add fields with additional information or buttons here, visually change the display of information.
Backend. Here we are overriding the methods for CRUD (creating, reading, updating, deleting) elements on the server.
Operations. Local transformations to perform CRUD operations for subsequent sending to the server.
Local. A collection with data received from the server is stored here for convenient work with it, and scale parameters are also set here. For example, the scale unit. The unit can be hour, day, week, month, year. Here we can set the width and height of this unit.
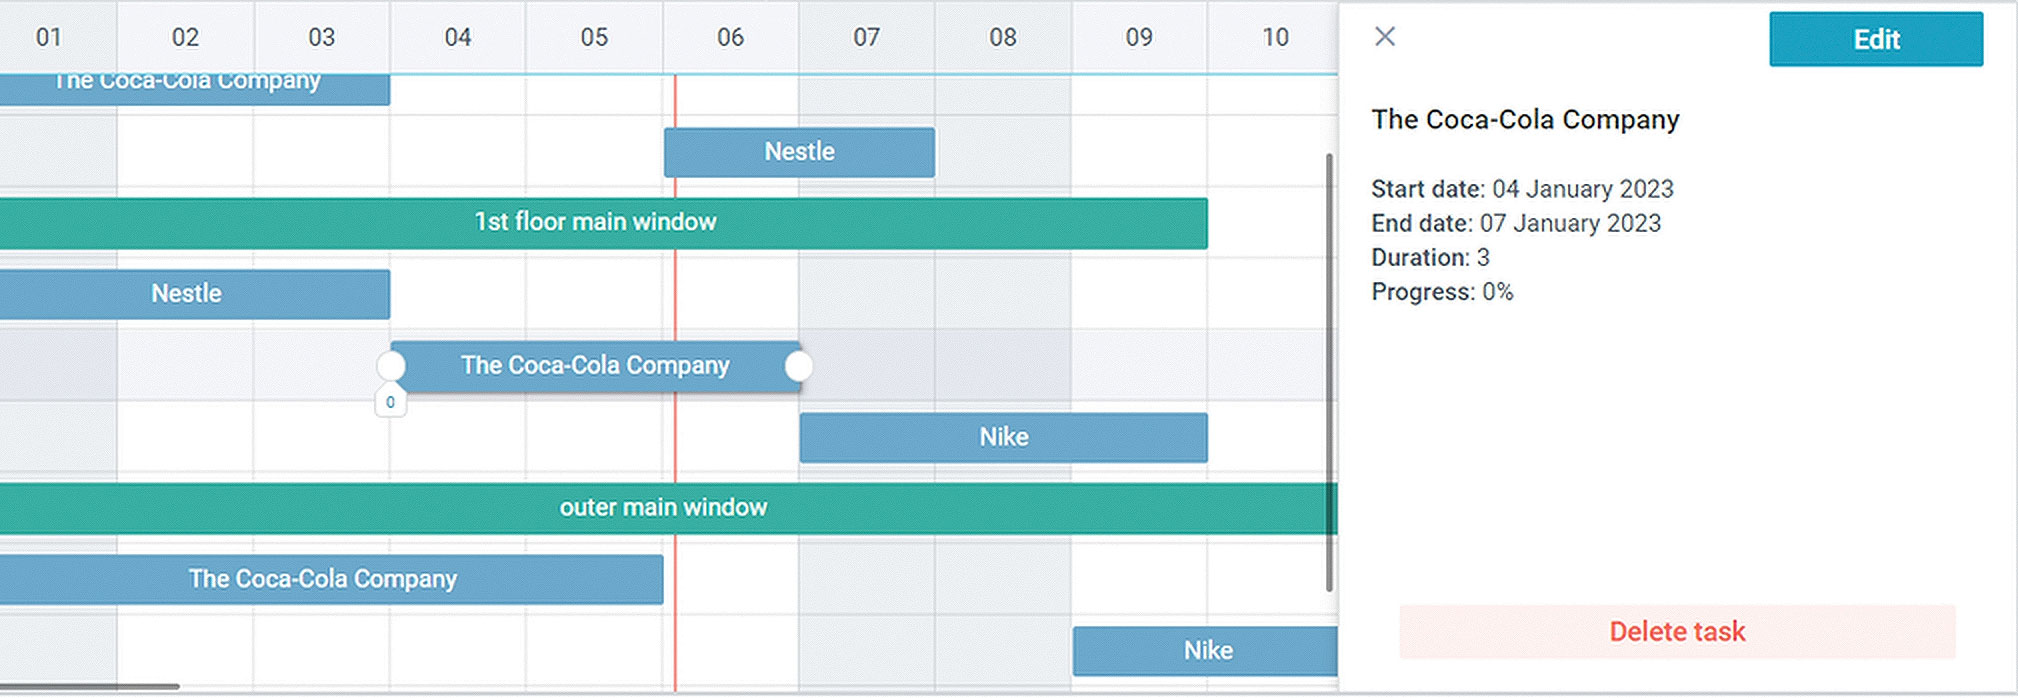
Scales. Responsible for rendering the entire scale area.
Task View. Side window with detailed information about the element.
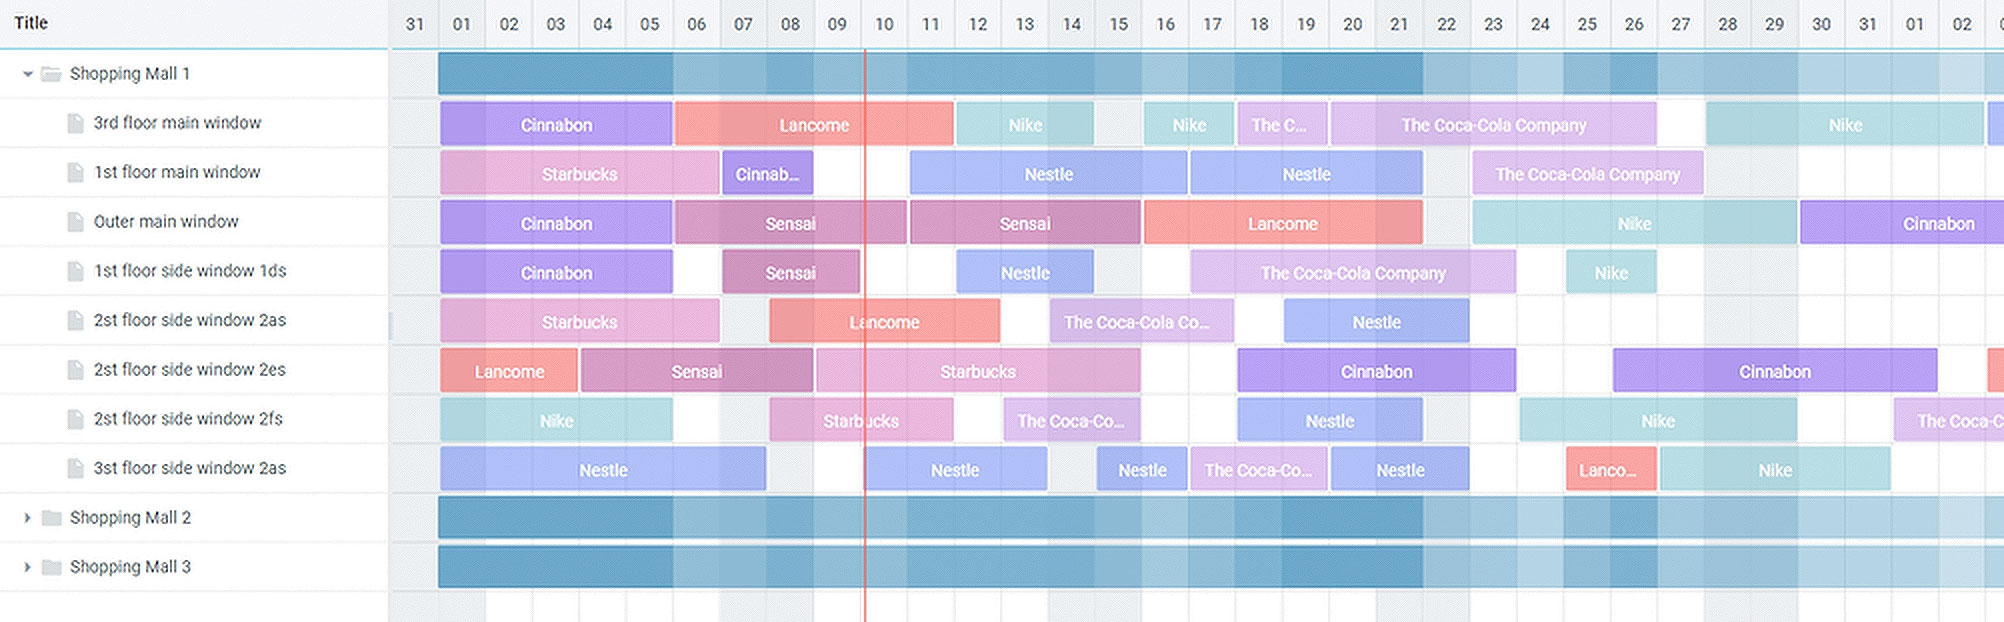
But return to the task about advertising. We generated data in random order for this example. After a little work on the data display, we get this:
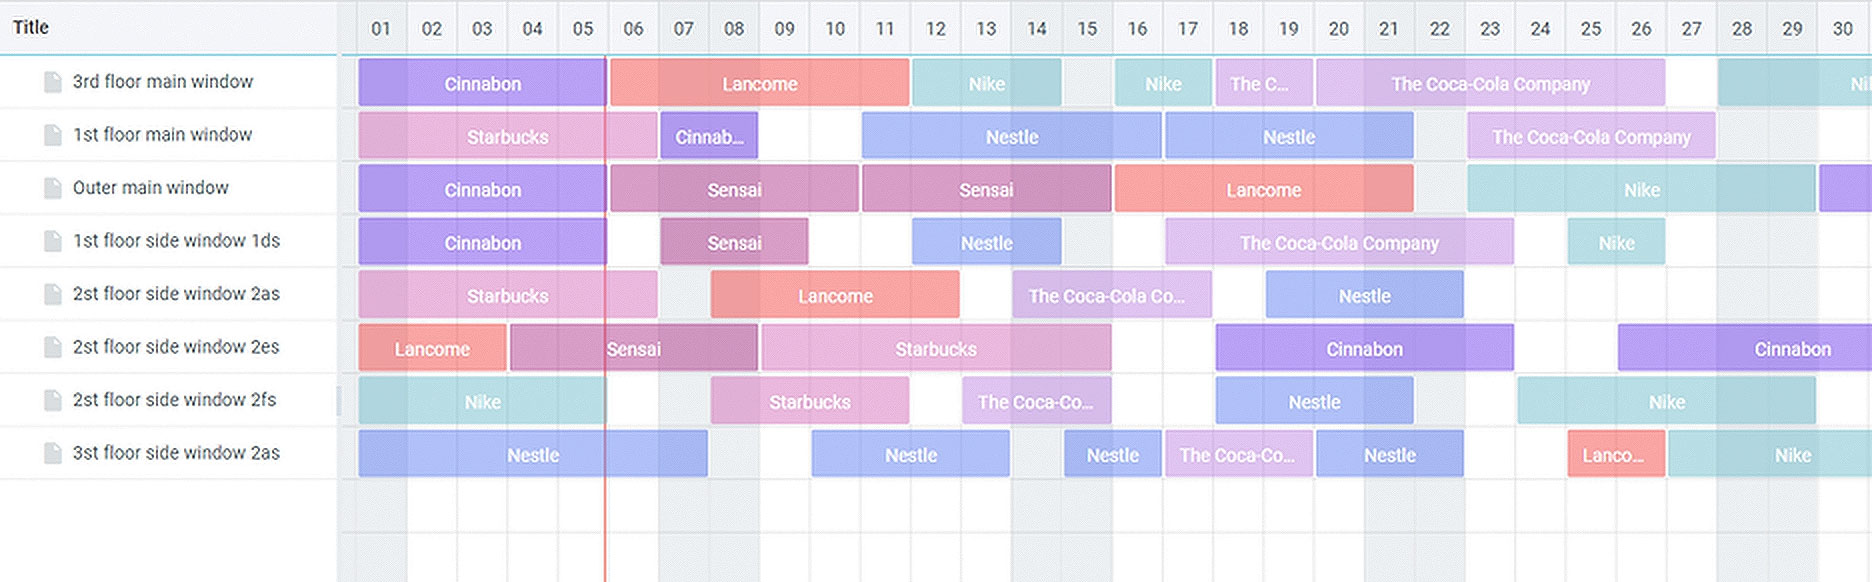
This looks more convenient and visually pleasant, isn’t it?
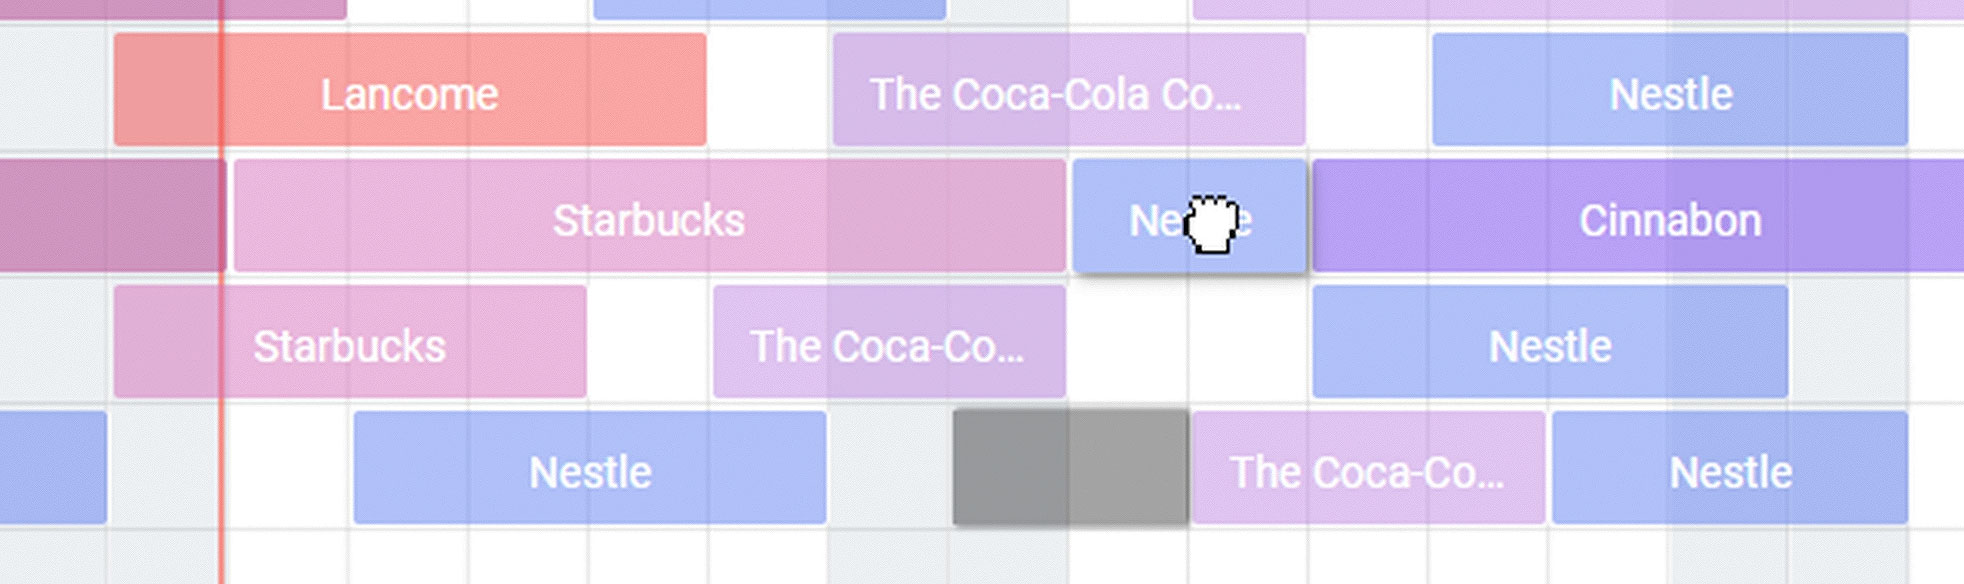
Of course, we should be able to move and stretch them. At this stage, we also set up validation so that we are not able to layer ads from different companies on top of each other.
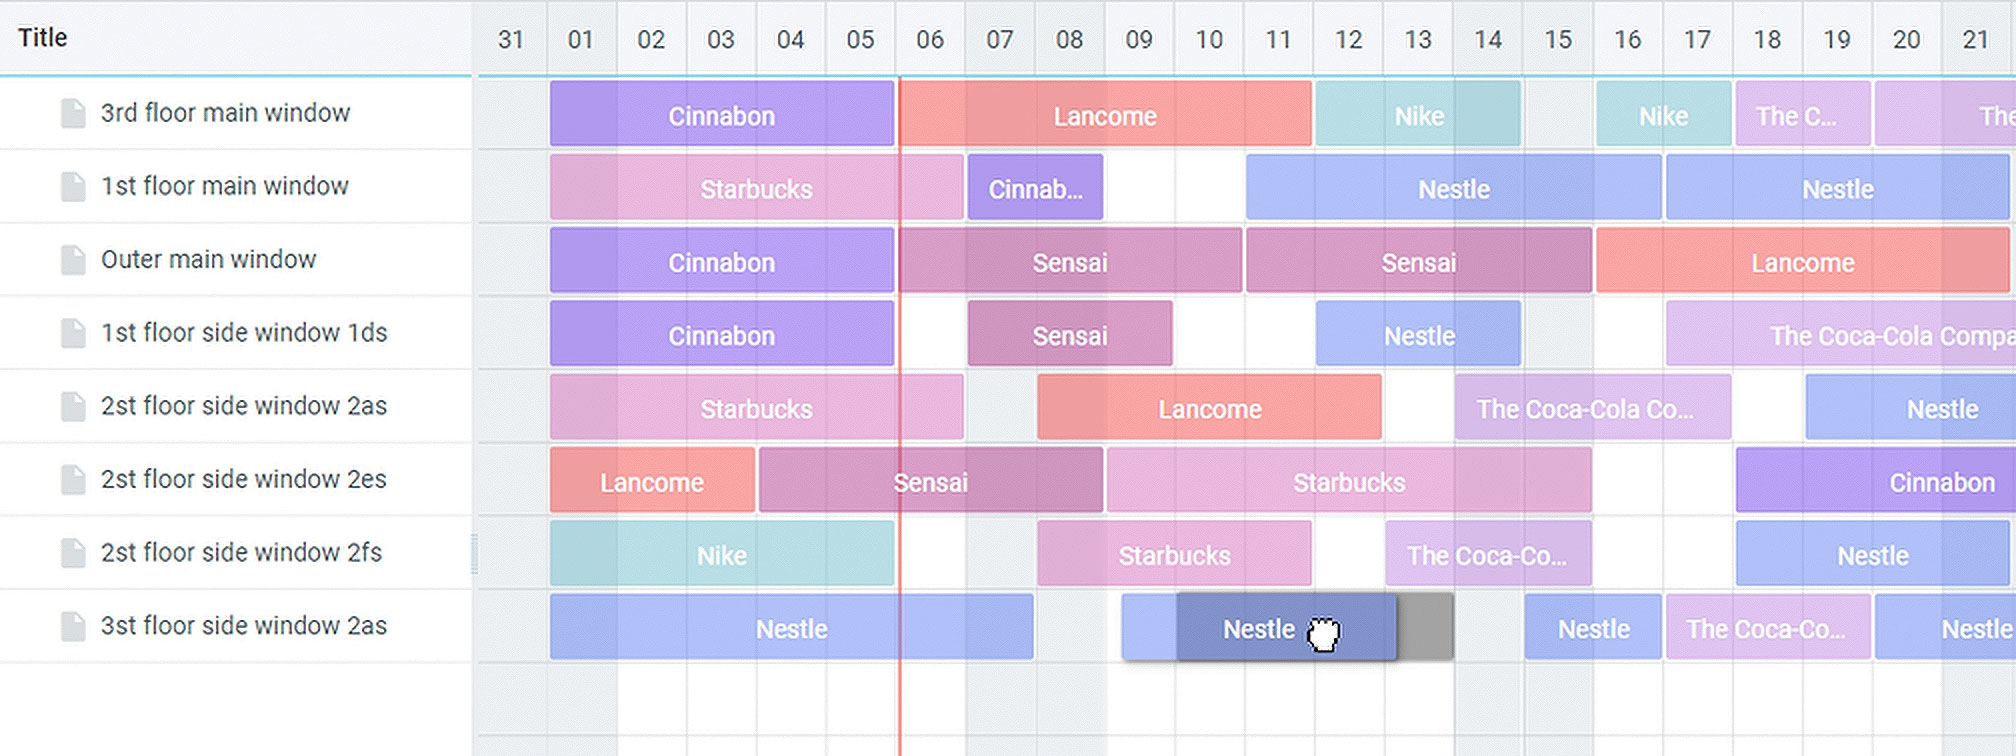
Horizontal movement is included in the basic set of Gantt functionality. We just need to override this behavior due to the changes of process displaying.
So, we have ads from different companies that are placed on a particular screen. It is clear that it may be necessary to move the advertisement to another screen, i.e. vertically. This is not provided in the basic functionality of the Gantt, so again a little customization was required here.
Let’s now imagine that we have not one shopping center, but a whole network. The amount of data increases several times. Firstly, now our data will have nesting – a list of shopping centers with a list of advertising screens inside. Secondly, as in reality it can be a large amount of data, it is better to load it in parts, and not in one piece. Initially, we load a list of shopping centers. At the same time, on the right side, we can no longer immediately display information about the placement of advertising on screens, but we can show the occupancy of the shopping center, for example. Next, we open a branch – a shopping center, and load a list of screens related to this shopping center from the server:
Fine. In the same way, we can add any filters: display data on one specific screen, on the type of screen in different shopping centers, if there is such a type, on a specific company, etc. Everything here is limited only by your imagination and product requirements.
As you see Gantt is a task management solution. It aids in resource organization and makes the working process easier and simpler.
Summing up, we want to say that the Gantt widget is suitable for any such case where it is necessary to show processes that are planned and limited in time, whether it is advertising at various points, or scheduling shifts for employees of different departments, or renting premises, etc.
Without a doubt, the Gantt chart should be considered a very valuable project planning tool. It will help you avoid many common mistakes, including:
- Underestimating the importance of starting a project.
- Ignoring dependencies between tasks.
- Inability to coordinate the transfer of project data.
- The fragmentation of individual tasks.
- Inability to track the progress of the project.
By setting the base config, you can easily embed the Gantt widget into any project and immediately test its basic features, and then, step by step, modify any part of the widget, add new functionality, and experiment.
Visualization of work processes facilitates project management. It helps to improve team interaction, organize and track the tasks of each participant. Graphical representation of information using a Gantt chart is one of the most effective planning methods used in time management.
You can create your own charts using any method. For example, make a Gantt chart manually on a piece of paper, in Word or in Excel spreadsheets. But, it is more convenient to use special applications in which you can quickly create your own project, assign deadlines, tasks, performers and monitor its execution at each stage.
No particular spheres, where Gantt solutions can be used and where not. If the sphere/project has many elements, or you deal with anything that should be structured or kept in any kind of hierarchy, (sales and consulting/ resource and workload management/ project management/ ERP systems) Gantt component will be very handy.
Read Also Taking the Best of React and Webix with Micro Frontends
Conclusions
As you can see, the Webix Gantt Chart Widget emerges as a versatile and powerful tool for project management and planning. Its ability to adapt to various scenarios (from marketing campaigns to product launches) demonstrates the flexibility and utility in organizing complex processes. The customization options we discussed in our article provide a pathway for tailoring the Gantt chart to specific needs, ensuring that it remains not just a visual aid, but a dynamic part of the workflow.
By integrating this widget into your systems, you can avoid common pitfalls in project management, streamline your operations, and foster a more productive and collaborative environment. The Webix Gantt Chart Widget is not just a tool; it’s a catalyst for efficiency, clarity, and success in any project-driven endeavor. So, if you want to know more about it or are thinking of implementing it into your application, please contact us, and we will show you all its ins and outs.