Any organization that generates a significant amount of data should take care of creating a convenient and reliable mechanism for its analysis. Business Intelligence (BI) is a term that we use for referring to methods and tools that companies can apply for representing raw business data in the human-readable format. Such an approach simplifies further analysis and improves the efficiency of the organization.
BI tools, such as dashboards, allow enhancing the workflow of an organization working with data. For example, in education, logistics and warehousing companies, healthcare organizations, etc. An educational organization can either use off-the-shelf software available on the market or apply for the services of a software development company specializing in data visualization solutions creation. Either way, such an approach will provide better insight and allow getting better control of students’ progress. In this article, we’ll consider the main benefits of adopting a BI dashboard in an educational organization.
BI Dashboards Help Educators to Make Data-driven Decisions
Every decision that changes the usual course of things within the organization should be based on detailed data analysis. Administrators should be able to get easy access to such metrics as student enrollment, academic progress, graduation rates, and more. Measuring and constantly controlling major indicators collected among different organizations allow significantly improve efficiency.
As an example of a successfully applied BI dashboard in the educational organization, we can consider the case of Hillsborough Community College. The Near Graduation program is based on the use of a data analytics dashboard. This BI solution can upload data from different departments and show the info on pre-graduation students that are not currently enrolled. College representatives can contact the most promising of them and offer to re-enroll and complete a credential. With this dashboard, the college administers got the ability to track the progress of students that are currently in the middle of the learning process which helps to identify those of them that have the most bright prospects. As a result of using this dashboard, the college has increased the number of graduates, and credit completions grew by 69 percent in 5 years.
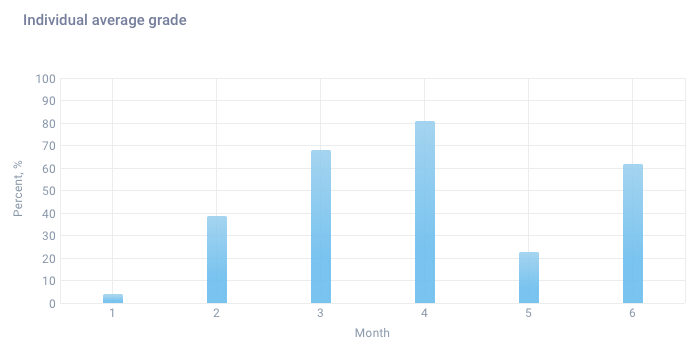
Here’s an example of how a properly designed educational dashboard can help to find students with specific talents. A bar chart can display a student’s average grade for different subjects. Such a form of data representation is more easy-to-read than a report card with ratings.
To make it even more informative, developers can add to the dashboard a bullet graph chart that displays all the grades simultaneously:
Such an approach allows quickly to assess the student’s academic performance and understand whether he has talents in one area or another.
Dashboards Simplify Analytics for the Board of Educational Organization
Applying for the services of a software development company, an educational organization frees itself from any technical routine. There is no need for you to understand the intricacies of the data analysis. Business analysts and developers will make their best to provide a dashboard solution that addresses the needs of a particular department or specialist.
Adequately designed BI dashboard can meet the needs of many different audiences such as the chancellor, chief officers, provost, academic deans, or any other employee of an educational organization. That’s why it’s essential for a developer to understand the data needs of different users and create flexible visualization tools and multi-featured dashboards:
- Student dashboard
- Course dashboard
- Tuition fee dashboard
- Enrolment dashboard
Data Drilling and Other Features Simplifying the Understanding of Data
This feature helps the users of BI dashboards to drill down values represented in the report. Imagine that there’s a report that shows fees paid by all students during the year. Using the drill-down functionality, you can get more specific data such as the frequencies or the types of fees that were paid by a student during the year. Cooperating with the business analyst of the development company that you’re dealing with, you can define what specific indicators should be represented in the reports. With this info in mind, developers can implement the possibility to get more details about the visuals with a simple click of a button.
Another important feature of BI dashboards is the possibility to combine multiple visuals. It allows getting comprehensive information on a particular student which can include invoices, medical history, academic progress, and other information. Additional to the dashboard such features as filtering and sorting enable organizing data for better understanding.
Here’s an example of how a dashboard can show the analytical data on the academic progress of a particular student:
This visualization allows for assessing the progress of a specific student in the context of the entire educational organization.
Scalable Solutions to Monitor The Performance of Students and Staff
Software development companies can create comprehensive, scalable dashboards suitable both for small educational organizations and nationwide departments. In the second case, there’s a possibility to implement a BI system that gathers data across universities, colleges, and schools. Data collected on different levels can be analyzed, represented in a human-readable form, and shared across various departments.
To use such kind of data for educational effectiveness, reporting, researches, and determining funding needs, it’s crucial to identify individuals accurately. The example of the Florida Department of Education shows that even a statewide solution for monitoring of students is not an insoluble task. The organization has created a unique identifier of students and staff across colleges, schools, and other organizations. Florida’s Education Identifier (FLEID) is a solution that allows increasing reporting accuracy and improve stakeholder experience. Thus, applying the due approach, it’s possible to work with really vast amounts of data.
Read also How Webix Data Visualization Features Can Improve Customer Experience
Conclusions
Business intelligence solutions, such as dashboards, are indispensable tools not only for business companies but for every organization that has to analyze significant amounts of data daily. BI dashboards in education can provide the following benefits:
- Enhanced analytics helps in recruiting students
- Dashboards help to improve administrative services
- Reduced costs on paperwork
- Tasks can be completed in a short time
- Dashboards allow a better understanding of student behavior and academic progress
A properly designed dashboard can provide you with a quick overview containing the major indicators. If needed, you can use the drill down or search feature to get more detailed and specific info related to a particular student or organization. According to the needs of a specific user, there can be dashboards providing different types of data. Following the requirements of a customer, a software vendor can implement a solution that works across a single organization or an entire country.