Any company, small or large, generates a huge amount of business information. Without the right approach for storing and processing data, all the info that you collected during the years of work will turn into a burden to carry. But as soon as you adopt a properly designed business intelligence system, you’ll get the possibility to make your data work on you. A custom-made BI solution can significantly increase business performance by systematizing the data you have and representing it as an informative and interactive dashboard.
To shed some light on how software development companies can make it possible, we’ve created this brief review of key business intelligence technologies. Moreover, we’ll consider the most important business intelligence tendencies in 2018 to help you to keep up with the market.
An Overview of Must-Have BI Technologies For Better Data Insight
Information Infrastructure
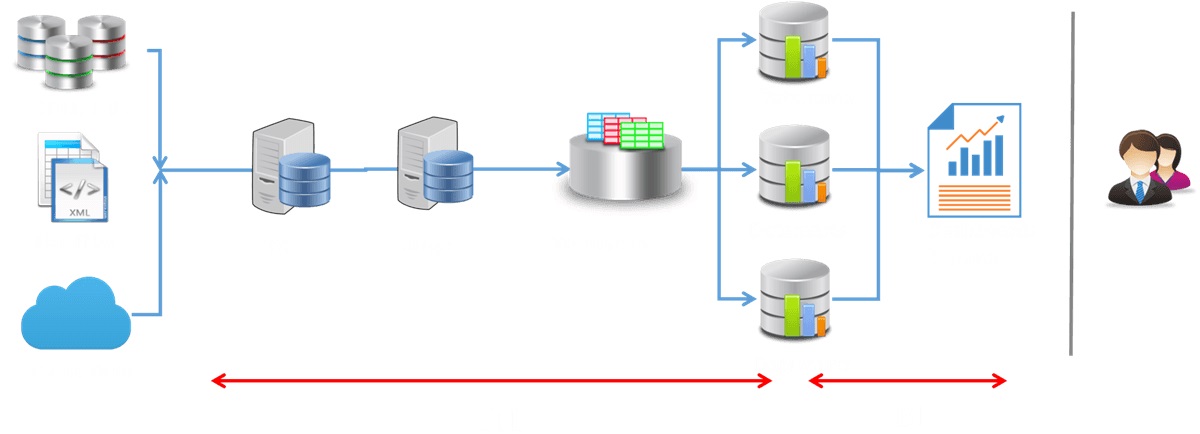
First and foremost, you have to implement a reliable technology for information storing and analysis. If you work in a big company, you most probably face the necessity to use multiple sources. Such info as orders, sales, client profiles, and performance indicators may be located on different storages. If you want to review all this info from the past several years, exporting lists of records and sifting through them may become a very time-consuming task.
Data warehouses are systems that companies use for information analysis or with reporting software. They allow integrating info from multiple sources and provide access to a centralized repository. As a result, you can use a single query to view the information you need despite its exact location. You can always get a big picture of your organization by reviewing historical info on different indicators combined from different sources.
Source: DataGaps
For companies that work with large databases, optimizing database performance is a crucial task. Among other performance-oriented technologies and tools, one that is widely used for business intelligence solutions is Online analytical processing or OLAP. OLAP tools allow analyzing large volumes of information from different perspectives by providing such functions as filtering, drilling and visualizing key insights and KPIs. Company staff and management can analyze information quickly and discover trends with minimum efforts. Adopting OLAP tools you can save time on analysis, improve financial performance, and increase customer satisfaction.
Reliable Visualization Tools. Informative Dashboards
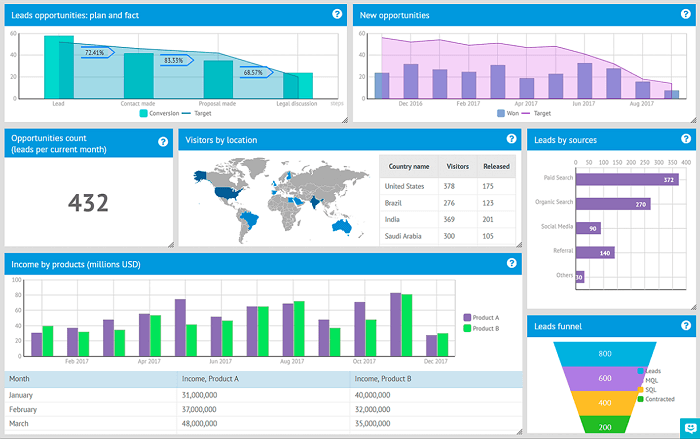
It’s not enough to provide users with reliable access to data. To extract useful info from it, proper visualization is required. Due to the exceptional role of data visualization tools in business nowadays, there are dozens of technologies and tools that can turn raw business information into a set of interactive graphs and charts. The commonly used type of visualization tools in business intelligence is a dashboard. Dashboards are informative, easy-to-read, usually single-page, real-time user interfaces that use graphs and charts to provide users with a visual representation of business data.
With a business dashboard, you can review summaries, key trends, and comparisons both for current and historical data. Using this technology, you can see the performance of different departments of your organization which will allow you to make informed business decisions. A sales dashboard, for example, can be used to review various product lines sold, the current performance of the sales department, and sales numbers for different regions. Data-drilling is a technology implemented in modern business dashboards and helps to discover more detailed information and view the info that you have from another angle without any significant efforts. The key benefits of dashboards are the ability to:
- Use visualizes info anytime
- Spot trends with ease
- Keep track of key performance indicators
- Quickly gain total visibility or snapshots without having to run multiple reports
Advanced Reporting and Analysis
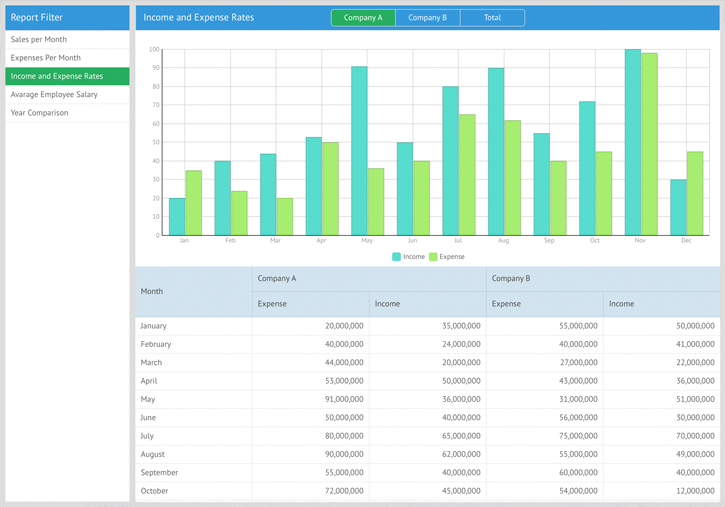
Reporting tools allow users of business intelligence apps to answer specific business questions. For example, as a manager, you may need to decide whether you should increase the number of goods in warehouses. To do so, you can generate some reports that will give you the exact answer.
Business intelligence solutions can provide users with the possibility to create, edit, and reuse reports. A software developer can add some business-specific templates to the reporting module which will allow generating reports in-a-click. Modern business intelligence solutions are often cloud-based which enables users to access reporting tools from any device which results in higher mobility.
Many business intelligence solutions go beyond simple report generation. For example, you may want to view info from different perspectives. Many self-service systems realize advanced interactive technologies such as drill-down, sorting, filtering, and many others. This possibility enables end users with more efficient data discovery. Also, such features as the ability to save, edit, reuse, and share reports help to simplify collaboration between staff members by giving multiple users the same resources easily.
Having all business information before your eyes sorted and presented graphically is a big step towards highly efficient data analysis. You can go even further and work with integrated high-end analytical tools from Cognos, Business Objects, SAS, or SSAS.
Data Discovery
Data discovery is a business-oriented process that allows detecting patterns by visually navigating data or applying guided advanced analytics. Software with this feature available simplifies the search for understandable structures within large relational databases.
Such systems analyze information and extract previously unfound patterns from it. For example, you can use this feature to analyze regional patterns of sales of certain goods. You may discover that some sociological groups such as elders, or students, use particular products more often on Mondays, or Fridays. You can increase your revenue by planning promotions and discounts on the basis of this newfound information.
The hotel performance management system developed by XB Software is an excellent example of such an app.
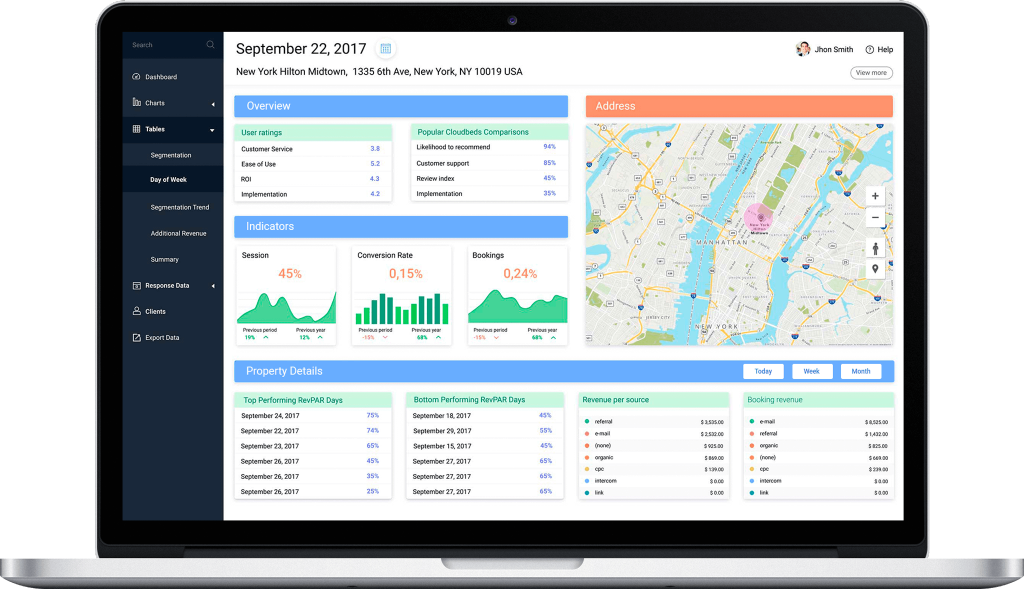
This business intelligence system implements technologies that allow providing users with interactive visualizations which helps to simplify the analysis and allows comparing performance indicators across the local market. During the development process, our programmers used Webix Pivot Tables and Webix Pivot Chart. Webix Pivot Tables support Web Workers which allows processing large amounts of data without any lags and freezes. Webix Pivot Chart, in its turn, allows creating neat and customizable visualizations. Also, pivot tables are an essential part of predictive analytics thanks to the possibility to quickly transpose, rotate, and split represented info into visible pieces.
Cloud-based Services
Cloud technologies allow using such features as customer relationship management, enterprise resource planning, and marketing automation from anywhere using any device. Such an approach helps increasing agility, reliability, and security of your work. To see how a cloud-based solution can improve your business processes, check our Live Demo Video about Avista, a smart process app for intuitive enterprise resource management and planning.
Cloud technologies allow deploying a solution faster than “traditional” software systems. Also, cloud solutions are easily scalable which allows you to adapt to the growth of your company and peak load times. Business intelligence solutions developed to scale can be fully deployed in the cloud without affecting baseline performance.
The Most Important BI Trends in 2018
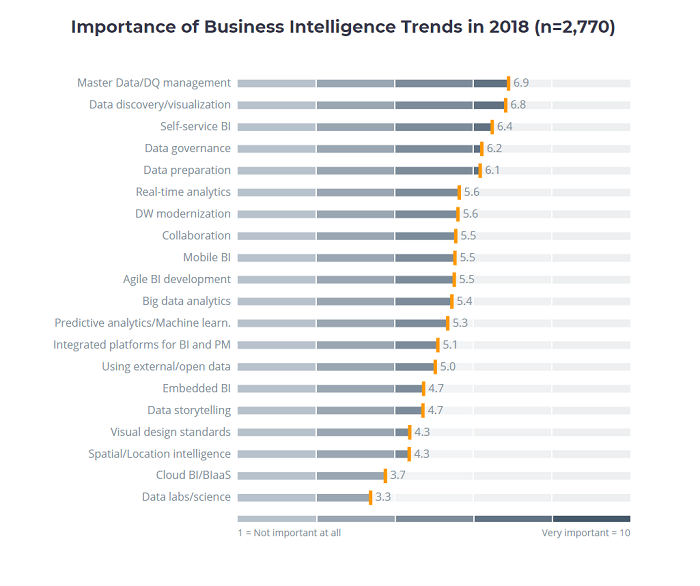
The BI-Survey resource has conducted a mass survey to define the most perspective trends for the business intelligence industry in 2018. Almost 2,800 users, consultants, and vendors were asked for their views on the most important modern business intelligence technologies and tools.
Source: BI-Survey
According to results, three main topics that business intelligence practitioners identify as the most important are:
- Data quality/master data management
- Data discovery/visualization technologies
- Self-service BI
Keeping an eye on these technologies and tools, you can be sure, that your business intelligence system is up-to-date and follow the cutting-edge trends. If you find that your current business intelligence solution lacks one of these essential technologies, you can contact a reliable custom business intelligence software vendor to integrate it into your system as a module.
Conclusions
A reliable and efficient business intelligence system is a complex mechanism of interacting technologies and tools. Data warehouses allow users no to worry about where and how the information is stored. Info from multiple resources can be accessed through a centralized repository of data. Then, this information can be visualized as an interactive dashboard. This informative and easy-to-read tool shows a visual representation of information using graphs and charts. Reporting helps company staff to answer specific business questions. Working alongside, these components allow your company to:
- Define growth strategy using interactive analytical reporting tools with clear and reliable data
- Gather, analyze, and structure info on your clients to adapt your strategy to the market’s needs
- Use info gathered by your company to define where to invest in infrastructure
- Review multiple KPIs through a single unified dashboard
- Use predictive analytics to make predictions about future business outcomes
Each custom-made business intelligence solution is built in full accordance with your business needs and includes the technologies that better corresponds to the needs of your company.