In this article, we’ll consider how you can use the Webix framework for data visualization in the financial sector. We’ll discuss some useful features provided by this development tool and take a look at a use case that demonstrates how a real web application intended to the analysis of economic indicators built with Webix widgets.
If you’d like to successfully track the situation on the market and predict future trends, you must pay close attention to gathering and further analysis of leading financial indicators. The nature of modern economics does not allow spending a lot of time on such kind of researchers. Trends change rapidly, so the task of processing vast volumes of data that contain financial indicators of different types has become a real challenge. But it’s not enough to analyze the gathered data. What’s even more important is to present the results of such analysis in a convenient and easy to understand form. One of the obvious solutions is a data visualization. Different types of charts and graphs allow significantly reduce the effort required to perceive and analyze the information. When you work with tables of data, it requires some time before you can draw any conclusions, but a correctly drawn diagram is usually understandable at a glance.
So, let’s check how Webix can help with data visualization in the financial industry.
Webix Visualization Tools
As it been said, one of the most common forms of data visualization is a chart. And Webix UI Framework has dozens of them.
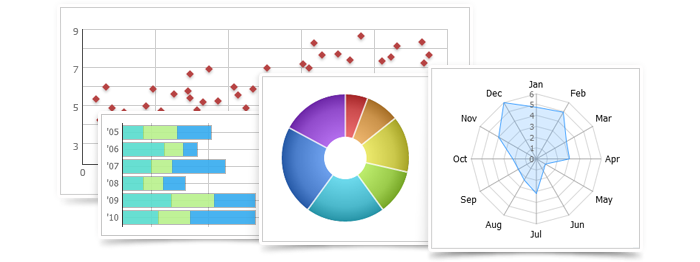
The list of available options includes Pie, Donut, Line, Spline, Bar, Area, Scatter charts, and other types. Following the declarative programming paradigm, Webix allows creating diagrams with minimal effort, spending as little time as possible. All that developer has to do is to for creating a basic chart define the chart type that he wants to get and set the source of data. Webix will take care of all the underlying job related to HTML and CSS. But do not let the seeming simplicity of use to mislead you. Webix charts are fully customizable and can be easily configured to meet your needs. Let’s take a look at some features of this kind of visualization.
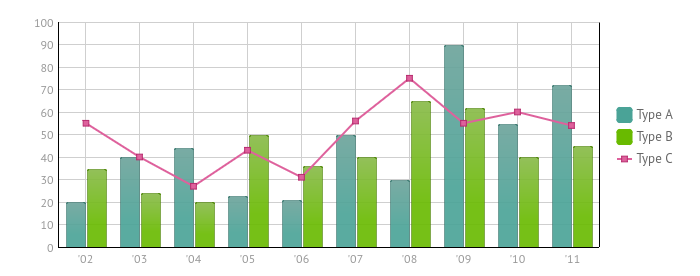
You can combine different types of graphs within a chart. It helps to compare multiple data sets, which is very useful for the financial industry. Clicking on the legend, you can hide or show a particular graph. Combining the graphical representation of several data sets may significantly simplify the comparative analysis. For example, you can display the sales of different company branches along with the overall company sales. Besides providing information on the state of affairs, such a graph will allow you to assess the contribution of each corporate division.
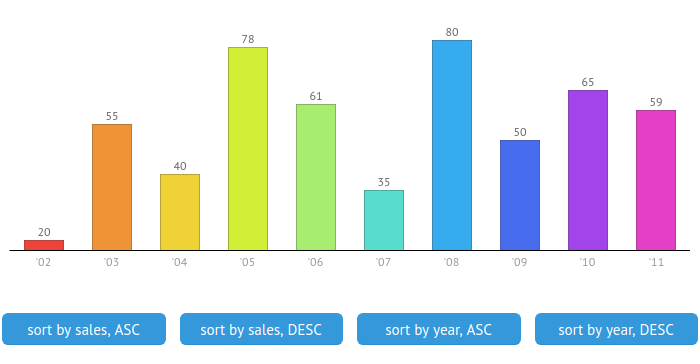
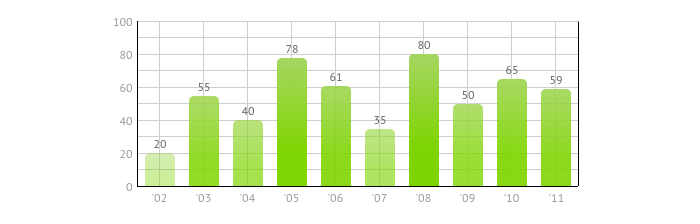
You can add buttons that allow sorting or filtering the represented data according to particular criteria.
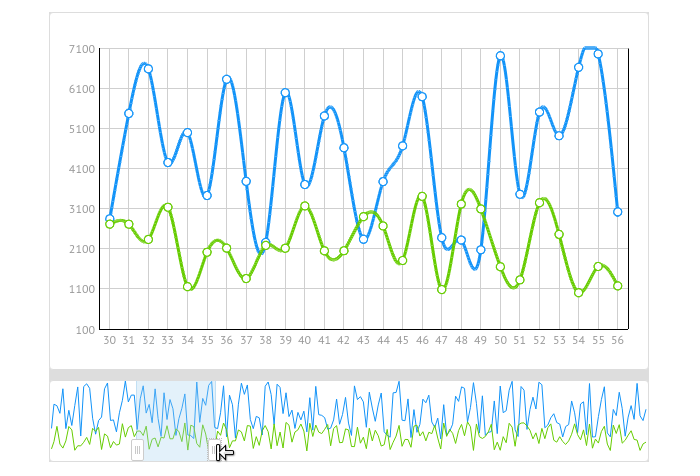
To predict long-term financial trends, you must first accumulate a sufficient amount of data. Analysis of indicators distributed over a large time interval implies some visualization issues. Gather all the available data in a single chart, and you’ll get a mess. Create a series of charts, and you’ll have to switch back and forth between them.
And what timescale should be chosen? A decade, a year, or maybe a month? Instead of trying to predict all the nuances, you can provide a user with the possibility to change the way data is displayed on-the-fly. Range chart is a special type of chart that allows displaying a particular data range. To select the range that you’re interested, you can move the frame at the bottom of the chart. You can use it for displaying financial data relating to a specific period.
There’s also a possibility to demonstrate how data changes over time using Dynamic charts. The rendering of each item in such kind of diagrams is animated. This feature can be used in apps intended for monitoring a continuously changing data flow. For example, you can create dynamic stock charts that provide users with information on any publicly traded company.
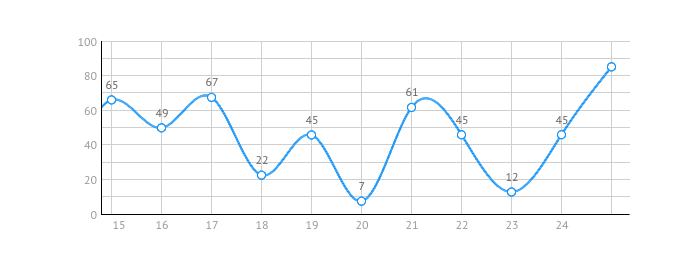
The appearance of Webix charts is fully configurable. Using CSS, you can get any desired look to be sure that it matches the design of your application. You can set the height, width, color, orientation, and many other parameters. With style presets, users can change the chart’s appearance on-the-fly. You can also change the chart’s legend and scale the way you want. By default, X and Y axes are formed automatically according to the user data set. But you can change that behavior by creating a template for text label of each axis.
We’ve considered the basic features of Webix charts that give you a general idea of how they can be used for data visualization in the financial sector. Of course, despite the functionality of the chart widget, it’s barely possible to develop a full-featured web application without any additional components. And Webix has a lot to offer.
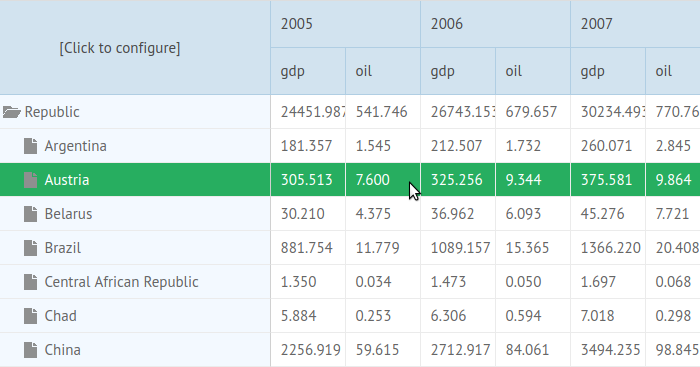
Among a wide variety of widgets of different level of complexity intended to work with various types of data, you will no doubt find those that can become a basis for your app. In particular, it’s hard to imagine applications for the analysis of financial information that doesn’t provide its users with the possibility to display enlisted data grouped and filtered according to particular criteria. Data visualization widgets such as DataTable or Pivot can provide the mentioned functionality.
We can spend a long time discussing available Webix components and their advantages. But the question is it worth discussing bricks if we can look at a house that can be built from them. For a better understanding of the possible results that you can achieve using Webix in your project, let’s check a real-life use case of this framework.
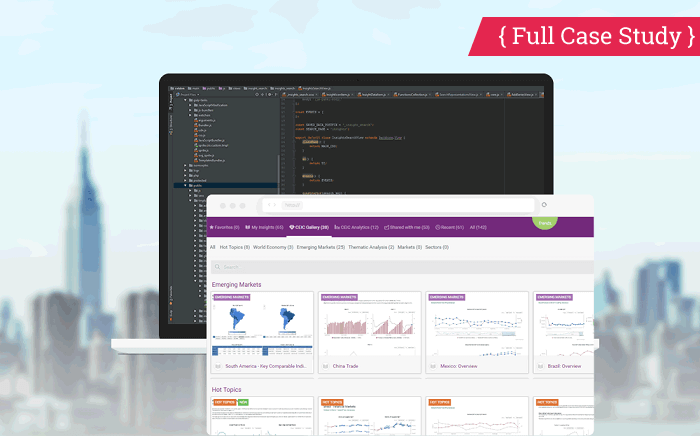
CDMNext. A Web Application for Leading Economic Indicators Analysis
CDMNext is a web app built with Webix and other web technologies. It’s intended for visualization of economic and financial indicators in the form of charts, maps, diagrams, and tables. The main challenge was to provide the possibility to work with up to 4 million data series gathered from 1,5 thousand of sources.
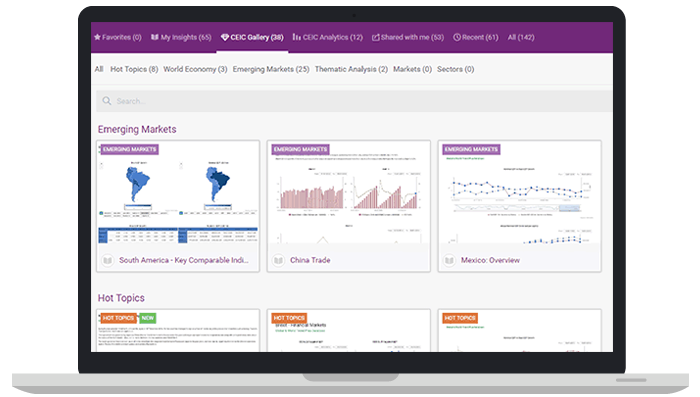
The data with which the application was supposed to work contains the most recent and historical financial indicators of 128 economies from all around the world. The task was to develop an application with a user-friendly and flexible user interface that allows getting access to the available financial data and also create custom visualizations based on certain criteria.
As a result of the developer’s work, the customer got an advanced cloud-based platform for financial and investment researches. The tool allows searching and data visualization works flawlessly on desktop and mobile devices. A user can visualize its insights and create up to 15 views, choosing a preferred style. In this particular example, Webix was used for rendering huge portions of data in a data table.
Conclusions
When we talk about financial analysis, time means a lot. The possibility to adapt to rapidly changing markets is the key to success. But the amount of data continuously grows, which turns its analysis into the issue that can be hardly solved without involving applications specially designed for such kind of tasks. Since the world does not stand still, the amount of time spent on development also plays its role. Webix is a framework that is intended to eliminate the efforts required for application development. It provides you with plenty of widgets that you can use to display data in different ways. Dozens of chart types, advanced data components along with the possibility to combine this framework with other development tools are quite good reasons for paying attention to it. Read about why data visualization is critical here.
You can also use our Webix customization services to build apps with similar functionality.
Find out more about custom web applications created with the Webix technology in our selected case studies: