Summary
The article introduces CDMNext, a web-based platform developed by XB Software in collaboration with CEIC Data, which gives users access to over 4 million economic and financial data series from more than 1,500 trusted sources. It enables analysts, economists, and investors to quickly explore leading indicators such as GDP, CPI, trade flows, and interest rates through advanced data discovery, transformation, and visualization tools — helping them forecast trends and make informed decisions.
XB Software is happy to announce the release of a comprehensive tool for the analysis of leading economic indicators (including GDP, CPI, Imports, Exports, FDI, Retail Sales, and Interest Rates), and other economic and financial data. The released CDMNext product provides access to the powerful economic database, which would help investors to anticipate any changes, adjust their strategies, and speculate on trends in the economy. Businesses can use this tool to forecast economic conditions and be ready for the changes that could affect their revenue growth. They can track leading economic indicators to timely respond to the changes in different spheres of economic and financial life.
A Unified Platform for Economic Insights and Financial Trend Analysis
CDMNext tool could be helpful for research departments of universities, engaged in building econometric models and implementing other global analysis. This tool incorporates all the necessary information to analyze and predict future financial and economic trends. CDMNext gives access to an economic database with microeconomic and macroeconomic data from over 1,500+ trustful sources providing over 4 million data series.
Two key participants involved in the creation of this tool were XB Software, an IT Outsourcing company from Eastern Europe, and CEIC Data, a Euromoney Institutional Investor Company from New York, the United States.
Supported by the XB Software team of web developers, QA engineers, and business analysts, CEIC Data has successfully launched CDMNext — a comprehensive economic and research tool for making right decisions on investment to enable economists, financial analysts and investors with access to leading economic indicators and other important economic and financial data.
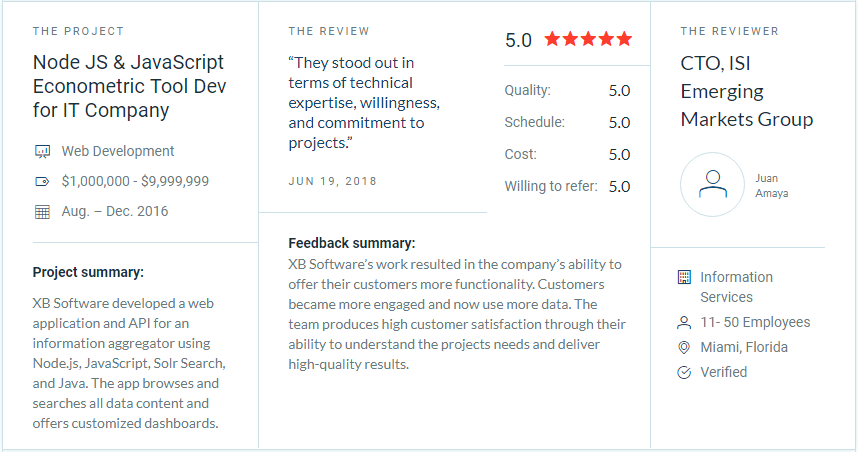
The project was reviewed on Clutch.co
About CDMNext in Detail
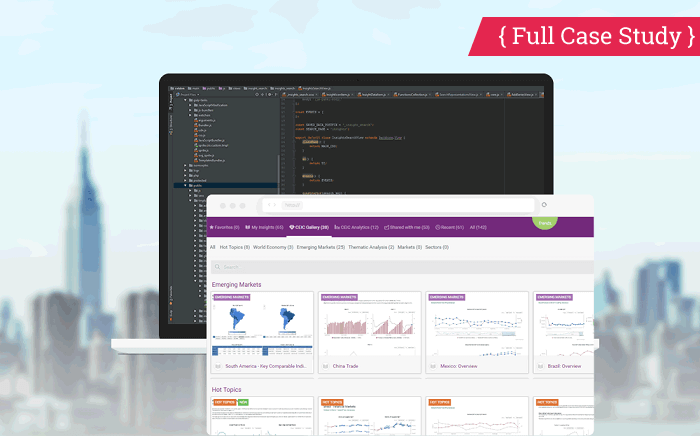
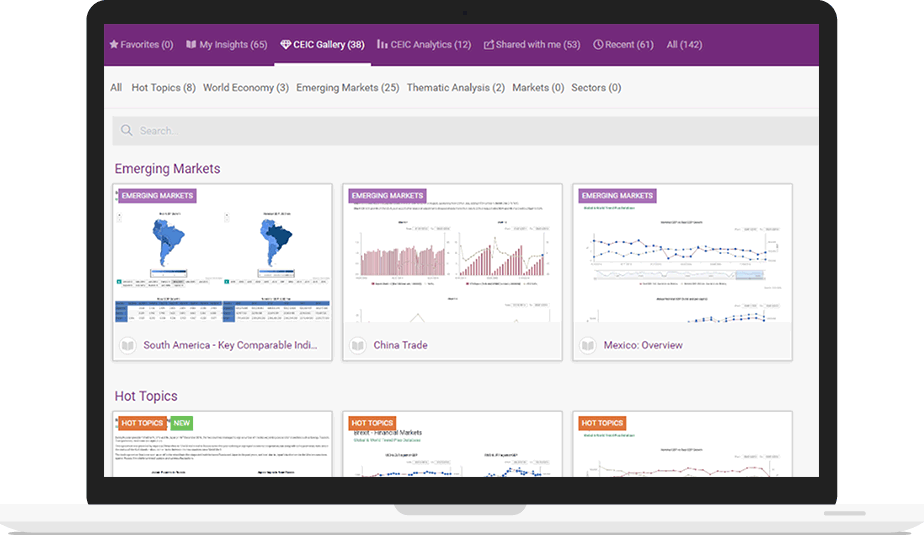
CDMNext is a powerful system that represents a web-based platform transformed from a generic data extraction tool. CDMNext allows users to quickly analyze leading economic indicators and other economic and financial data, creating personal insights (worksheets) with fast access to all CEIC economic databases. With CDMNext the СEIC Data investment company fulfilled a new concept of data discovery and tracking leading indicators providing advanced visualization, collaboration, and engagement model.
CEIC Data intended to improve the user experience of the existing WebCDM product, providing users with better navigation, simple data discovery, and analysis of leading economic indicators and other data, as well as improved visualization and management.
How leading indicators help different establishments?
Leading indicators are important for:
- Investors to track the situation on the market and predict future fluctuations
- Researchers to create short and long-term forecasts of the economic situation in the world
- Government establishments to forecast changes in revenues and expenses
- For startups to calculate return on investment and profitability
- For statistical agencies to track interdependencies between different sectors of the economy
Overall, CDMNext makes tracking leading economic indicators and easy and fast.
All improvements requested by CEIC Data were implemented in the new release.
XB Software specialists created an easy-to-use platform featured by enhanced performance, powerful search capabilities, and flexible UI.
Why Analyze Leading Indicators with CDMNext
The CEIC web application has been developed especially for economists and analysts. It provides rapid access to vast databases with deepest available macro and microeconomic series, including leading economic indicators, financial and sector data from hard to reach sources (1,5K sources in total).
The tool allows dynamic search and data visualization for more than 4 million data series from 128 frontiers, emerging, and developed countries. App users can create and upload their own insights (workbook), and identify trends.
Challenges for XB Software Team
- Processing vast volumes of data containing a lot of different leading indicators that have to be displayed in the UI and rendered properly in Excel
- Manual and automatic classification of 4 mln economic indicators implemented by XB Software financial analyst
- Fast search within all databases
- Intuitive UI
- Search optimization and smart count of relevancy
- Smart data rendering and visualization
Key Features To Help Work with Economic Database
The product consists of several sections for data discovery, data selection, data transformation, and visualization.
The powerful search capabilities allow finding series describing with leading economic indicators and other financial data that fit any search criteria. Live and manual search within all available CEIC databases have been added. In data discovery the tool supports:
- smart data search by series (keyword). Includes live search, Boolean operators, masks, exact search, etc.
- browsing by the database in a structured tree (6 levels)
- group series by main indicators
- multi-dimensional filters to sort results by selected criteria
- economic mapping of search queries and as-you-type suggestions
The platform is featured by user-friendly and flexible UI with drag-and-drop, right clicks, and keyboard shortcuts, which allows you to easily discover, manage, and transform data.
You can drag-and-drop any selected series from data discovery to data selection area, and view data in a list or a table format. Adding, deleting, and previewing of selected series is available.
Data transformation implies that you can apply math functions and carry out quick calculation right in the platform. A function editor is also available. For convenience, a brief description of how to use each individual function is added.
The tool provides excellent data visualization means, including chart, map, table, commentary, attachment, and image. Users can visualize their insights and create up to 15 views, choosing the prefered style.
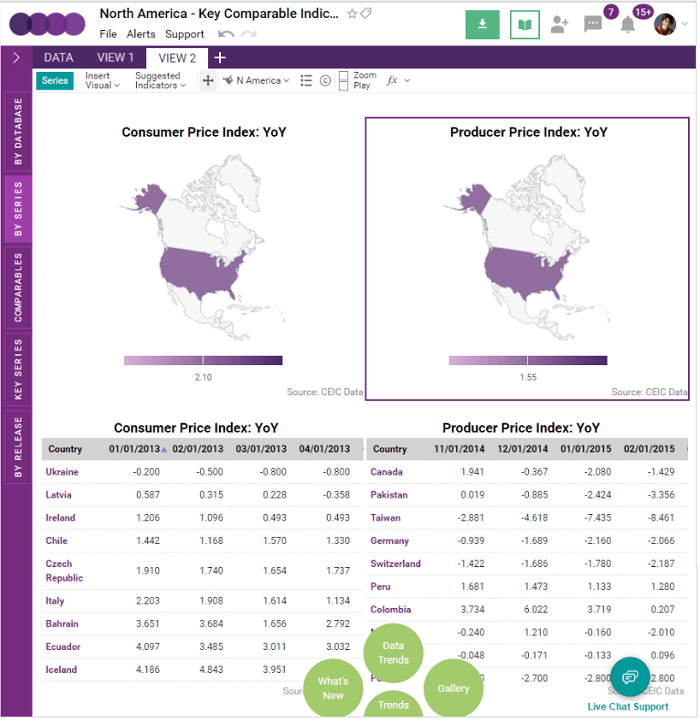
Leading economic indicators chart can be also built in the insights.
Whole insights or separate data or/and charts can be downloaded in any of the following formats: Excel, CSV, PDF, PNG, JPG.
XB Software made it easy and efficient for users to collaborate and communicate within teams, both distributed and co-located. Smart alerts on data updates in the insights and sharing modes with different rights were provided. Posting of different pieces of a project in social networks, blogs, and communities was also enabled.
Applied Technologies
The technologies and techniques used to develop CDMNext include Amazon web services, Node.js, Backbone.js, Webix, MySQL, Redis, Java, Python, MongoDB Cluster, Solr, Phantom.js, HighCharts, jQuery, Gulp, Webpack, SASS, WebSockets, Microservices. The modern version of JavaScript (EcmaScript 6) to improve code quality is used.
About CEIC Data (A Euromoney Institutional Investor Company)
CEIC Data was founded in 1992 by a team of expert economists. It specializes in economic and investment research and is trusted by economists, analysts, investors, corporations, and other organizations in 50+ countries. CEIC accumulates data only from quality primary sources and provides smart and flexible means to access vast databases of world economies.
About XB Software
XB Software is a web development and quality assurance company rendering full-cycle project implementation from requirements analysis to product development and post-release maintenance. Since 2008, XB Software has been creating robust web applications for clients from different industries (financial services, logistics, and transportation, education, customer service, etc.).
Find out more about CDMNext development in our case study: