Summary
The article reviews JavaScript libraries for data visualization and explains why the authors favour Webix and DHTMLX as optimal choices for enterprise applications that require flexibility, maintainability, and deep integration. It shows how components like Webix Kanban and Diagram widgets, or DHTMLX Gantt, Scheduler, and Spreadsheet, give teams powerful tools to build interactive dashboards, schedule systems, project management tools, and data‑driven apps faster — without sacrificing long-term control or customizability.
When a business requires to store and work with a huge amount of data, it is important not only to have the needed resources to be able to manage it but also to know how to visualize the data. That is why various data visualization tools and practices exist. Most of the time, companies don’t have time to think about building pie charts or graphs, they need their data right here right now. It doesn’t matter whether you work in an enterprise or you are a startup business owner, there will be a time when you realize that you need a clearer and more intuitive graphical representation of the information and data your company stores.
In this case, many organizations turn to data visualization software and are looking for a quicker way of applying visual elements and improving overall user experience. Utilizing data visualization libraries that are based on JavaScript is the most popular option among companies from diverse industries around the world. Front-end developers choose JavaScript framework due to the fact that it uses modern web standards, such as HTML, CSS, and SVG. But there are many JavaScript data visualization libraries, which can make it difficult for you to choose the suitable option. D3.js, Chart.js, ApexCharts, Highcharts, CanvasJS, Google Charts, Three.js, etc. are not the only options that can be considered for utilization. To decrease the amount of choices, we want to talk about Webix UI Library and DHTMLX UI Library that are perfect when you want to speed up the development and design process and have stunning results with minimum effort.
Which Criteria to Look for When Choosing JavaScript Library for Your Project
The methods of developing data visualization software include a great variety of visualization techniques, however, not always and not all UX/UI design practices are implemented successfully. Especially, when you have no time to sit and figure out which color to use and where, because your developers and designers are dealing with the other projects. Or, you may simply not have any developers to begin with and just want a system that will work as intended and will help the workflow of your team. This is when ready-made solutions are here to save the day.
Read Also Misleading Data Visualization: This Is What You Should Avoid
Before diving into the pool of different JavaScript data visualization tools offered by Webix and DHTMLX, it is essential to decide on your goals and requirements first. In general, there are certain questions that you need to ask yourself or brainstorm with your team in order to understand where to start and what to search for. Let’s take a closer look at the list of questions you may have:
- How large is the dataset that needs better visualization?
The size of the dataset that your system will control matters, because not all JavaScript visualization libraries are able to handle huge amounts of data. For example, the libraries that are based on SVG are usually deployed on small or medium datasets. That is one of the reasons why both DHTMLX and Webix use CSS/HTML5 JavaScript controls, because they are able to process big data.
- What is the targeted platform of my system?
Platform-specific applications may require one solution, while cross-platform software development needs other frameworks and libraries. Thus, in the example below where a Real Estate ERP system was built, React.js and React Native were implemented along with Webix to let clients launch software both on desktop and mobile devices. Therefore, you have to make up your mind whether you want a web-based software, mobile application, or everything at once. Also, check which libraries your web browser supports if needed.
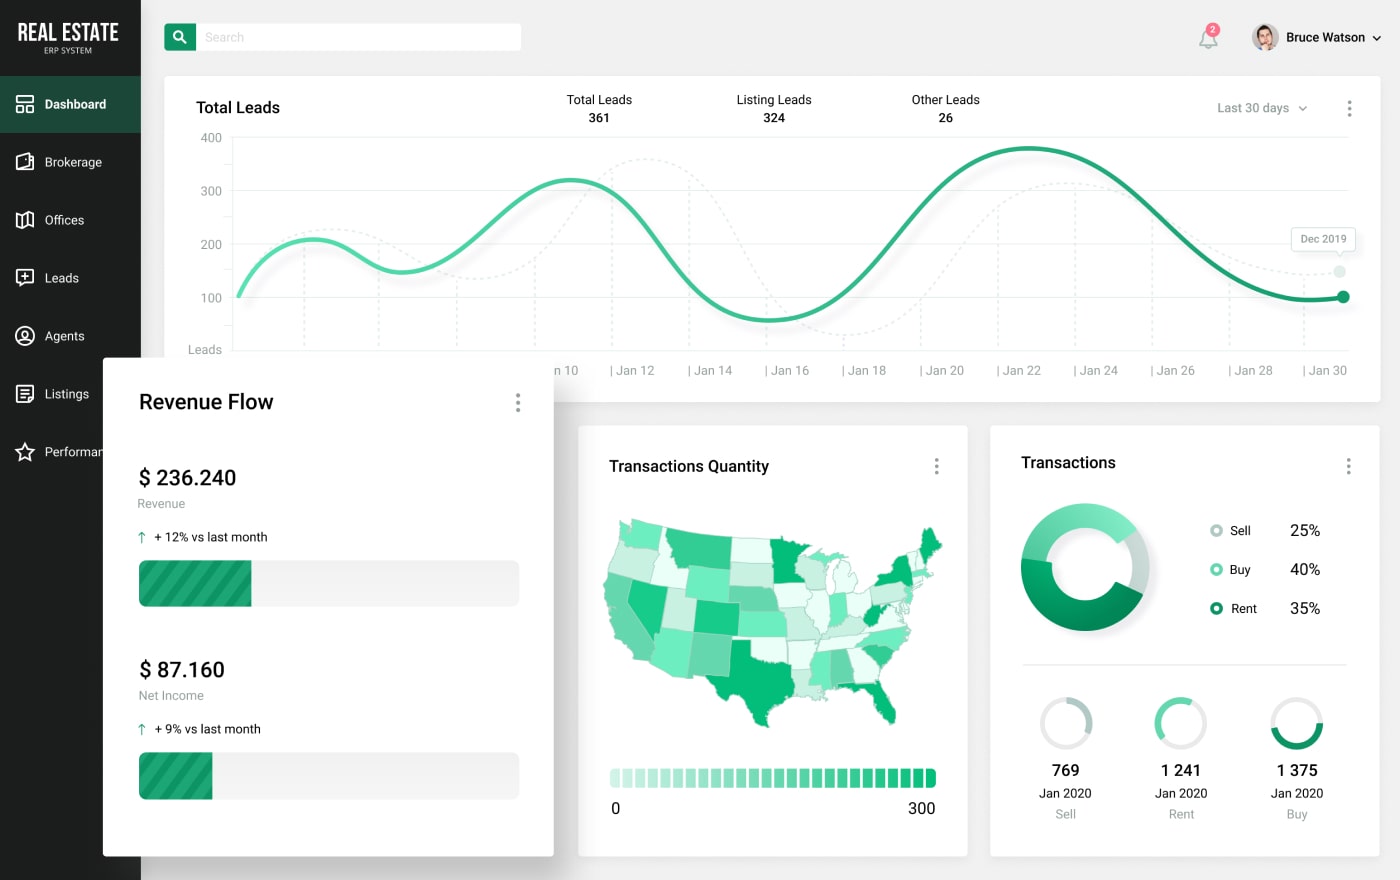
Source: 360° ERP System for Real Estate
- Am I using a specific JavaScript framework in my company?
Not all libraries and frameworks may be compatible with each other. So, if you already have a system in use and are planning to improve its representation of data to enhance the performance of your organization, it is better to start with the foundation. Literally. It means that you should know which framework your current application is based on, so that you will be able to build a least buggy system.
- Do I need unique customization or do I prefer common and established options?
If you have an idea in your mind that contains complex animations or some innovative decisions, you need to consider that as well, because it may decrease the amount of available options.
You may have more questions that need to be answered, so it won’t hurt to review all details with your team to be sure that your choice is the right one. You can also consult experts in outsourcing services and IT staffing to leave to those who have experience in this area.
Read Also Making Your Team Bigger the Most Efficient Way. How IT Staff Augmentation Works
JavaScript Data Visualization Components Offered by Webix and DHTMLX
Now that you know which questions are the common ones and where to begin with, it is time to show you why DHTMLX and Webix are the best JavaScript data visualization libraries that will answer most of those questions. Let’s start with the Webix UI Library.
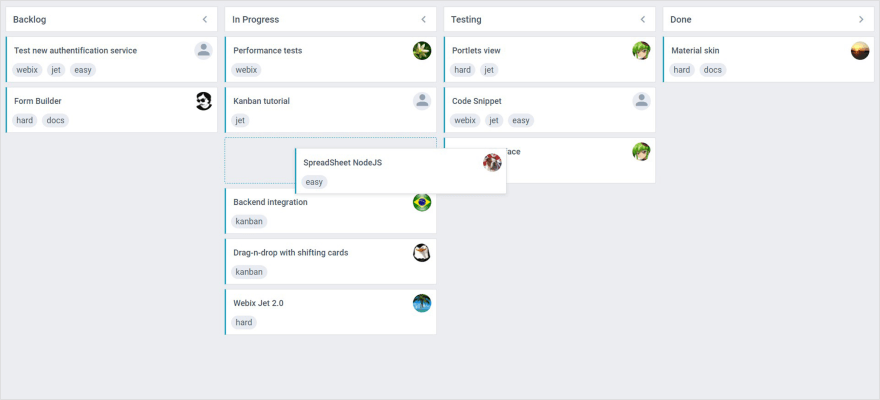
Kanban is a Lean workflow management method that is popular among different organizations. Therefore, Webix created a customizable widget that can improve planning and managing processes of your team. Kanban JavaScript UI widget, also known as Tasks Management Board, is a ready-made JavaScript component, which is perfect for interactive data visualization and can be built into any project management application to save the time that will be spent on the tasks when you use the created system. Overall, it also saves development time, because it has easy backend and frontend integrations.
There are many ways to visualize data, including charts, bars, and so on. And, using diagrams is another option to consider. The ready-made Webix JavaScript Diagram Library is about creating all types of diagrams to make the data as clear as possible. It can be integrated with popular frameworks and libraries, such as React, Vue.js, jQuery, AngularJS, and more. The styling is easy and quick, while you can also be sure that navigation will be smooth.
Source: Webix Javascript Diagram Library
Being able to manage user roles, access rights, and permissions for your system is one task, while visualizing all the related information the way that everyone understands how to check the needed details is another. The system should be intuitive and user-friendly, and Webix User Manager can help with that. Implementing this JavaScript component saves time and cost spent on the development process, because it has a built-in security audit and can be integrated and customized with ease.
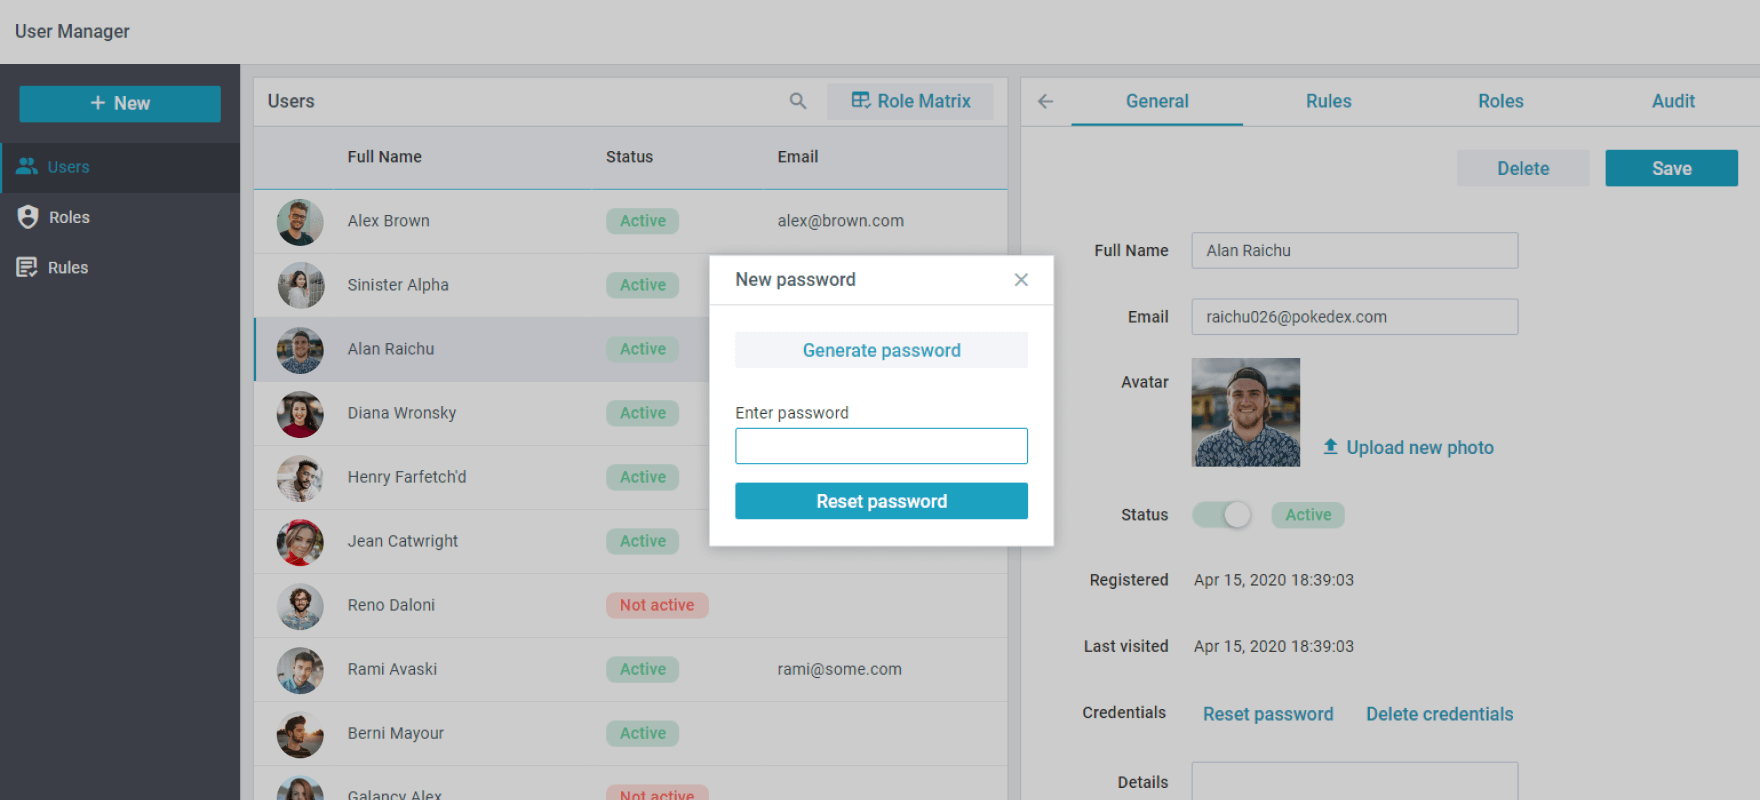
Source: Webix User Manager | JavaScript Widget
Webix UI Library offers a significant amount of widgets, and these three components are not even the half of what you can use from the Webix JavaScript widgets.
If talking about DHTMLX UI Framework, it is also full of options that can brighten up your software. So, let’s look at some of the options you can consider using.
Gantt chart is one of the most popular data visualization tools for project management software. Our DHTMLX team created the JavaScript DHTMLX Gantt component to assist businesses in building web-based alternatives for project planning tools. With its help, you can adjust assignments accurately and utilize many histograms and charts.
Source: DHTMLX Gantt | JavaScript & HTML5 Gantt Chart
For example, we used DHTMLX to help one of our clients, a U.S.-based sea cruise operator, to replace manual reporing and the usage of a legacy scheduling system with limited functionality with a custom DHTMLX Gantt-powered unified fleet management system. The client was satisfied that choosing this UI compontent granted a faster development process and the ability to customize the system the way their business needed.
Read Also Optimizing Fleet Operations Through DHTMLX Gantt-Powered Scheduling
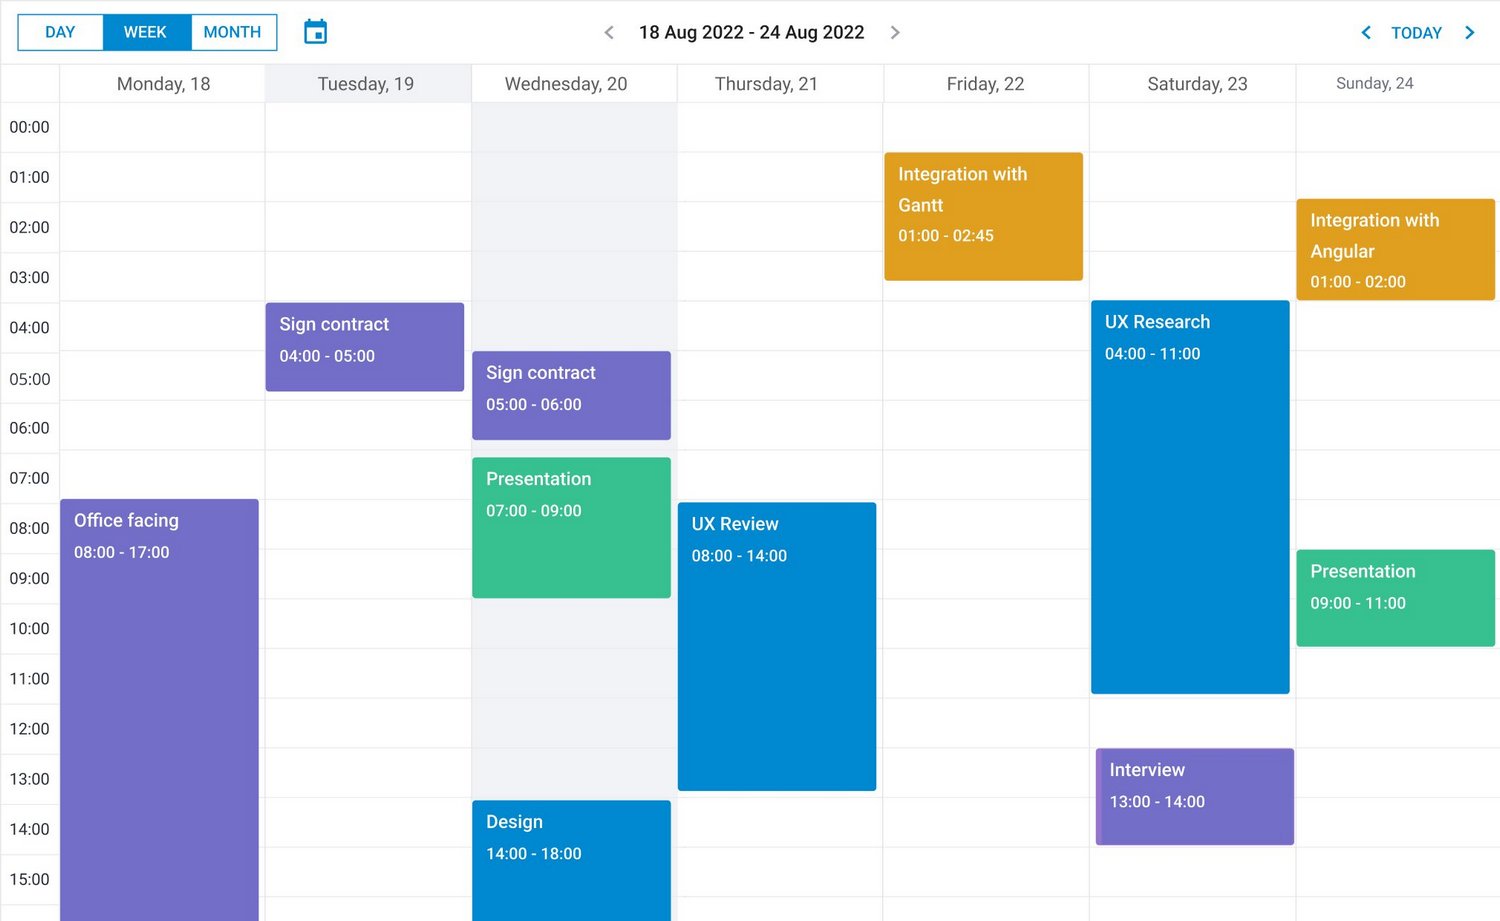
If you want to have a scheduling solution with an intuitive and highly customizable interface that will be similar to Google Calendar or Microsoft Outlook Calendar, DHTMLX Scheduler is what you may like. It is a JavaScript scheduling calendar with powerful JavaScript API and responsive design.
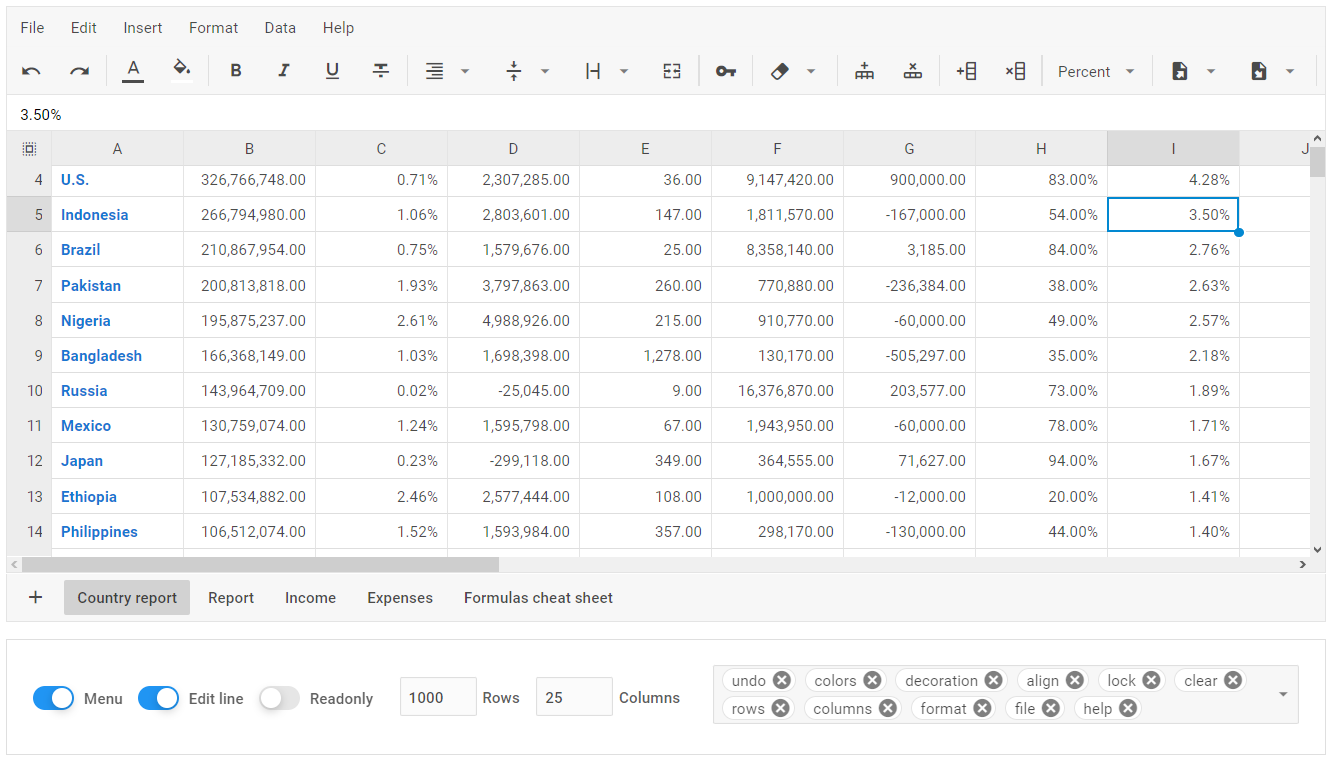
For those who want to add Excel-like spreadsheets and be able to display the stored data in a table view, there is DHTMLX Spreadsheet. This highly customizable component has support for popular string functions and math formulas. With DHTMLX Spreadsheet, you are able to format and edit data in a convenient and safe way. Besides other features, there are multiple sheets, it is compatible with different browsers, and you can import or export data to JSON.
There are even more DHTMLX products that you can choose from if you want to have better experience with your application and make it visually pleasing.
Read Also Data Visualization Software: Making Visual Representation of Your Data Effective
Conclusions
There are a lot of different data visualization tools, and the vast majority of businesses use JavaScript visualization libraries to have more flexibility and control over company systems and their add-ons or features. That is why we showed Webix and DHTMLX as two popular options that have these aspects. If you want to know inside details about our products from Webix Service Team or DHTMLX Team, contact us and we share the information with you on how to better implement the libraries.