Data visualization tools and dashboards, in particular, have become an integral part of any enterprise management process. Every company department is chasing specific goals that require analyzing a large amount of external and internal information. Marketing specialists, sales managers, or financial analysts pursue different goals but have one thing in common: the need to work with an enormous amount of information. The better way to track the status of such goals is to use an interactive visualization dashboard that allows monitoring of all related metrics. The question is how to choose a reliable software vendor and suitable technologies for the future web tool to guarantee a better possible outcome.
Developers adore the React JavaScript library. Its popularity has steadily increased in recent years, and we can consider it as one of the most trendy libraries at the moment. It’s easy to learn, highly flexible, and light-weighted, which makes it a good option for developing a wide range of web applications. In this article, we’ll consider how React helps our development team to create comprehensive data visualization tools and what benefits it provides to our customers. As an example, we’ll take a look at a dashboard for currency exchange rate management created by XB Software.
Technologies That Helps to Reach Your Business Goals
![]()
Our development team uses a broad range of cutting-edge web technologies to create visualization tools that make our customers happy. We won’t describe each of them in details in this article. Instead, we’ll focus mainly on the React library and its core features that allow reaching high performance and excellent quality of data visualization.
Virtual DOM
Among the other features of React, virtual DOM is especially important for interactive dashboards. Such apps have a lot of continuously updating components that allow you to track various indicators simultaneously in real-time mode. Non-stop flow of stock and currency rates or any other data should be displayed on the screen instantly without any lags or freezes. Only in this case, you can be sure that you work with a dashboard that provides the most relevant information and allows making fats data-driven decisions.
The Document Object Model or DOM is the way to represent the object on a web page and allow users to interact with them. Everything that you see in your web browser is a part of a hierarchical tree of elements called the DOM tree.
To make dynamic and interactive web applications such as data dashboards efficient, developers have to do some serious work to ensure that DOM will be re-rendered as fast as possible after the new data appeared. In the case of highly loaded web apps, it can become quite a challenge.
That’s when Virtual DOM comes to the rescue. It’s hosted in memory which allows React to change its state in a blink of an eye each time the actual DOM is changed. Such an approach allows React to collect all changes of the web page elements, compare them to the actual state of DOM, and refresh modified components.
As a dashboard user, you don’t have to keep this algorithm in mind and even fully understand how it works. React can figure out the optimal way to update the web page components, and all you have to do is to surf on the waves of data.
Isomorphic JavaScript
Isomorphic JavaScript is another cornerstone of high-performance web-based dashboards. When you open an online app in your browser, it takes some time to load the page content from a server. During the loading process, a user can see some fancy loading animations on the screen. In the case of a high-loaded Single Page Application (SPA), this process can take a long time. It may become a serious issue when you want to get fast access to the dashboard with the most recent business data but have to wait until the page is fully loaded instead.
With isomorphic JavaScript, there’s the possibility to use the same code both for the server-side and the client-side parts of a dashboard app. Such an approach allows you to get speed benefits from rendering on the server. After the page is loaded, React can still render the components. Besides the faster loading speed, isomorphic JavaScript helps to speed up development time. With other modern frameworks that don’t support this feature, developers have to create the views for rendering on the server-side along with the client-side templates. With React, it’s possible to build components that work on both sides. For you, as a client, it means that you can get an online app that implements described functionality faster and without any harm to the quality of code.
Reusable Components
One of the main features of React is that it allows creating reusable components for web applications. It enables to reduce development time and simplify the process of the further upgrade of your system.
React Native is a library that allows developing mobile apps for iOS and Android with React. It can simplify and improve the process of mobile development. Since there’s no need to use two completely different technologies, when you decide to hire React JS developers to create a version of a dashboard for smartphones as well, it’ll be an additional advantage.
Continuous Development of the Library
Developers constantly update the React library and add new features regularly. Therefore, you can be sure that your React-based solution follows the cutting-edge trends in web development and implements the latest performance-oriented features.
For example, React 16 that was released in September 2016 got the new Fiber Architecture. It’s a new implementation of React’s core algorithm that, for example, implements new rendering logic that enables a better approximation of the principles of animation.
Great Ecosystem
React has a rich and diverse ecosystem. There’s almost certainly a ready-to-go solution for the majority of developers’ issues. Dozens of available charts, graphics, documentation tools, and other components allow developers to focus on your particular needs rather than waste time reinventing the wheel. You can check this Awesome React collection to make sure that a variety of solutions is a real thing.
React itself makes a great work in providing excellent user experience. But you should remember that it only renders your views. To create a full-featured dashboard, you have to use additional development tools. Thanks to its high popularity, there’s a lot of visualization tools providing React integration features. Let’s consider some examples.
![]()
Even if your app is as fast as a shark, it means nothing without proper data visualization. To make raw data easy readable, our development team uses a vast amount of visualization tools. One of them is Highcharts, a JavaScript visualization library that allows creating interactive JavaScript charts for the web.
![]()
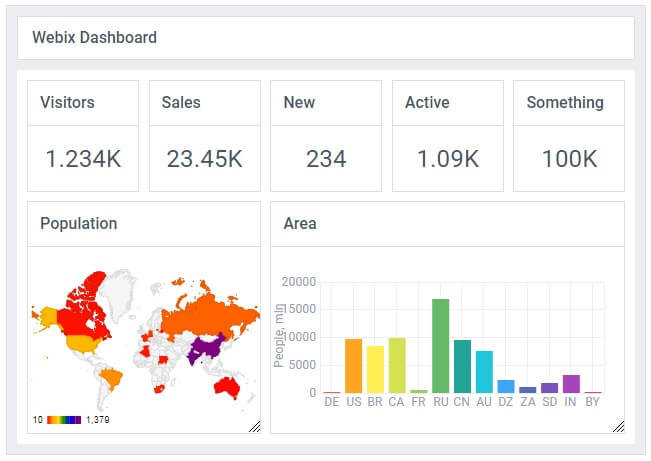
It’s not enough to decide from which visualization components your dashboard will consist. Another crucial task is to ensure their convenient placement on the screen. The Webix Dashboard widget is a flexible tool for solving this very task. Developers use it to place UI elements neatly into a grid. Users can customize visualization dashboards made with this widget by dragging dashboard panels and creating the layout that better suits their needs. Also, there’s the possibility to resize panels, use custom-made menus for accessing quick actions (deleting panels, exporting data, displaying additional info, etc.), save and restore the state of a dashboard.
Read also How Webix Data Visualization Features Can Improve Customer Experience
Web-based System for Tracking Stock and Currency Rates
Here is an example of one among many other data visualization solutions made by XB Software. Our development team has created a full-featured web-based visualization dashboard that allows tracking stock and currency rates in a real-time mode:
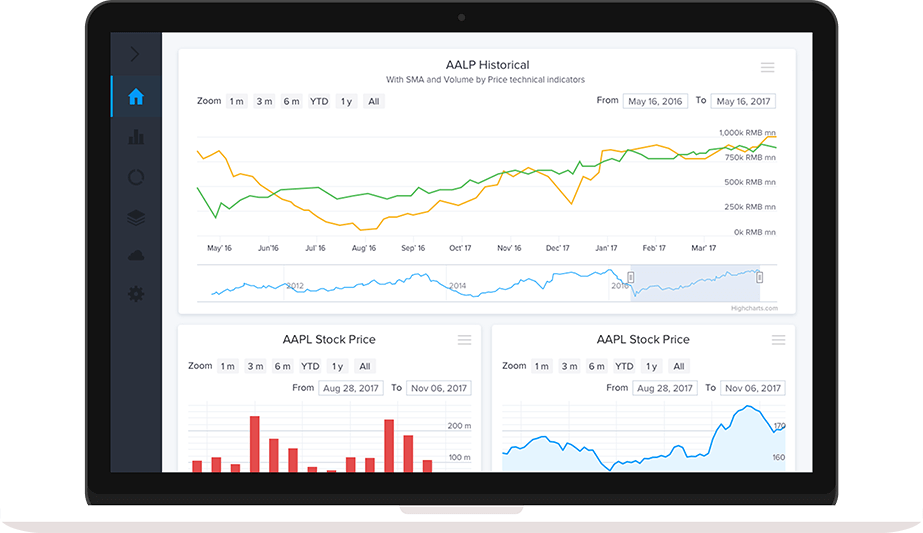
This interactive tool for stock data visualization provides searching for new opportunities by analyzing and dynamic scanning of numerous markets. Also, the dashboard can be configured according to the needs of a particular user. Live market data on currencies, options, and equities help users to implement accurate analysis and build an effective trading strategy. One of the main challenges for our development team was to create a dashboard that could handle the constant traffic of large financial data streams. Thanks to the React library, our developers overcame the difficulties and provided a high-performance visualization solution that strictly follows the requirements of our customers.

Conclusions
In the world of business, decision making speed is vital. Modern technologies allow implementing visualization tools that provide users with lots of useful and relevant information that can help to build an effective business strategy. To get ahead of your competitors, you have to be sure that you can get instant access to the latest market data and your software solution won’t let you down at a key moment. React is one of many other development tools that allows our development team to create data visualization dashboards significantly improving your performance. Its main features are:
- Virtual DOM that increases the performance of highly loaded applications
- Isomorphic JavaScript that allows rendering web pages faster
- Reusable components that speed up development time and simplify mobile app development
- New features are constantly added
- Rich and diverse ecosystem